


 68 / 136

Notes to the Financial Statements
Washington H. Soul Pattinson and Company Limited
Annual Report 2016
66
Group Structure and Performance
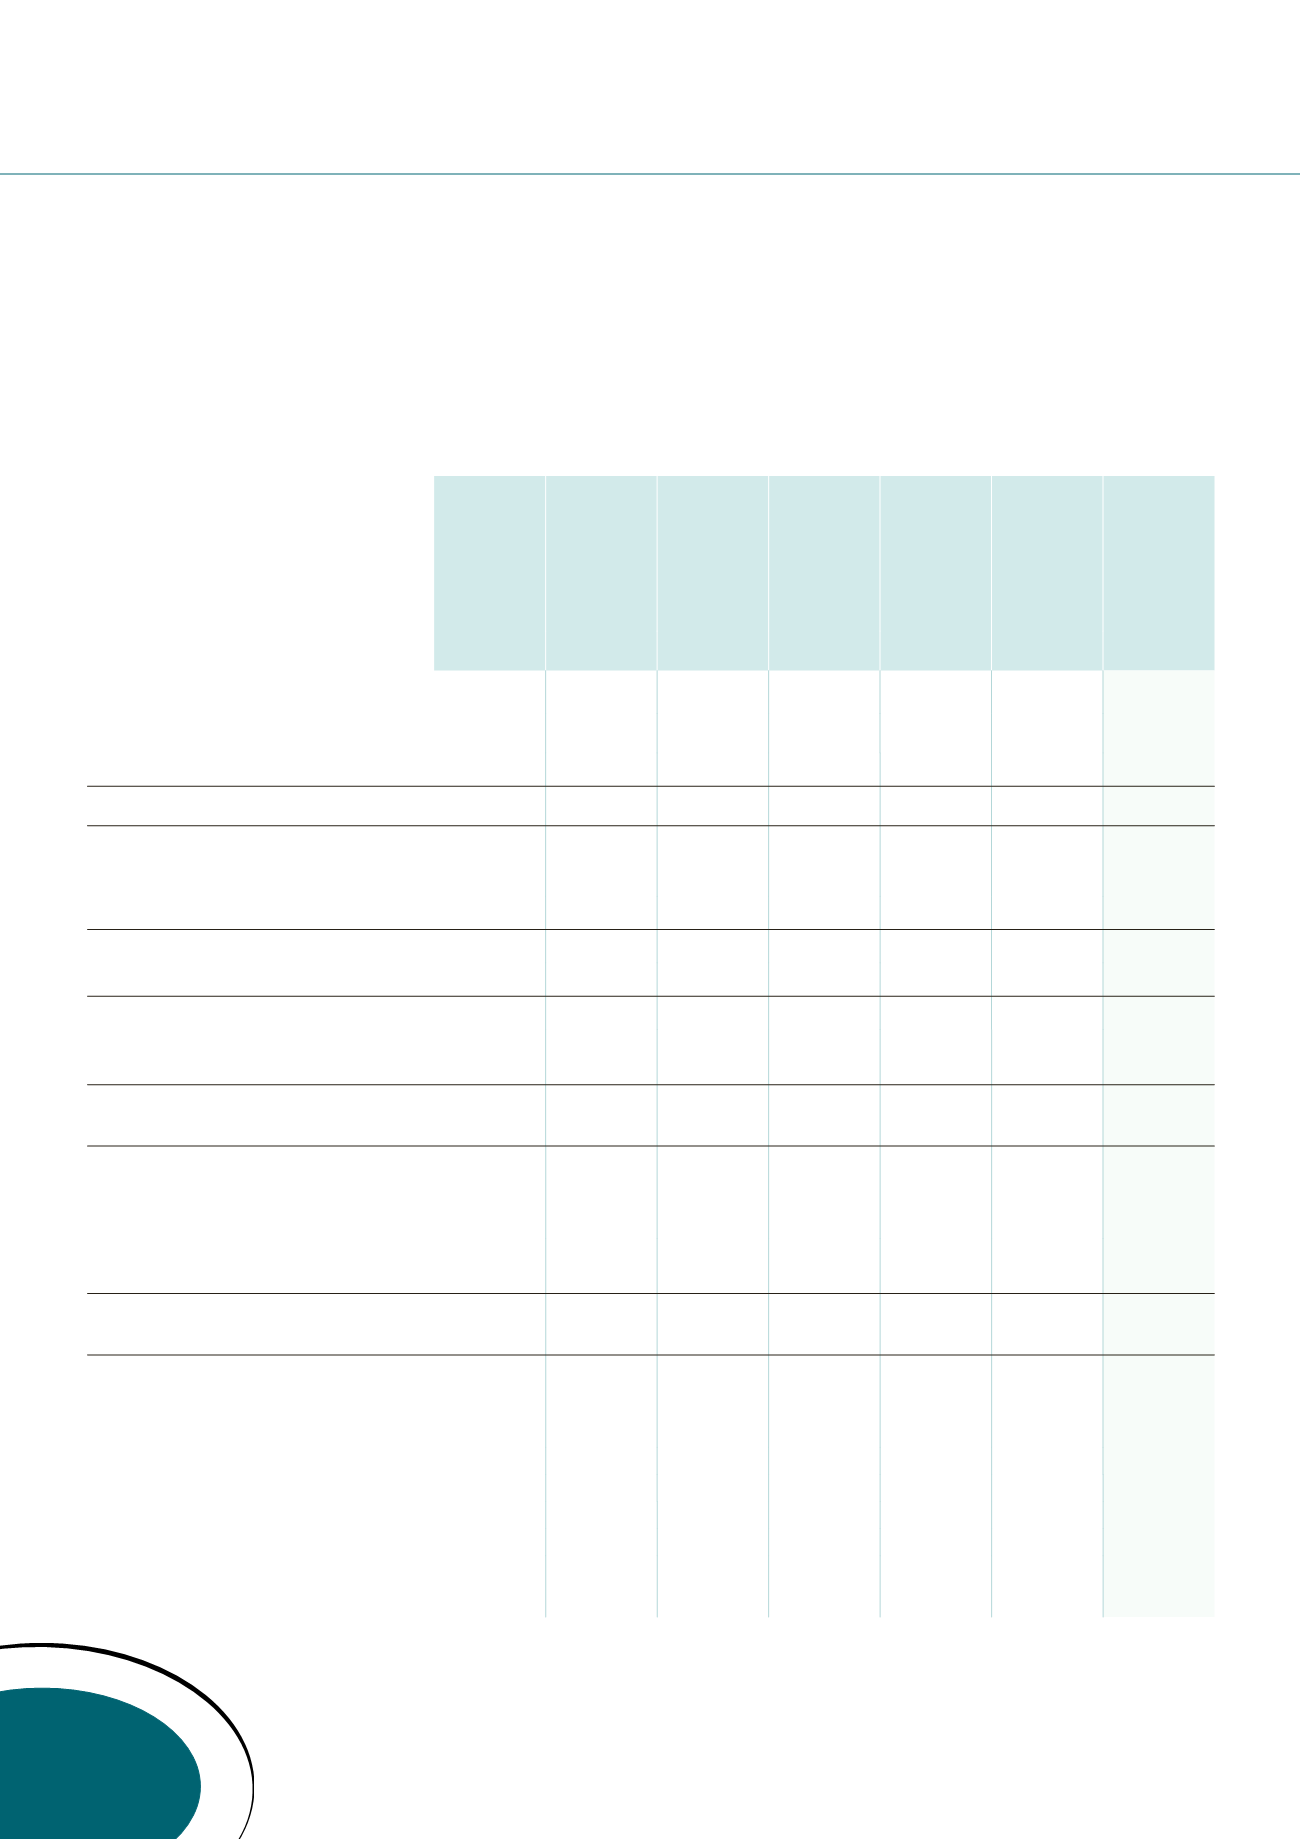
3
NOTE 3
SEGMENT INFORMATION – HOW THE GROUP IS ORGANISED AND MANAGED
(continued)
a) Reporting segments
(continued)
Investing
activities
Energy
Copper
and Gold
operations
Corporate
advisory
Property
Intersegment/
unallocated
Consolidated
$’000
$’000
$’000
$’000
$’000
$’000
$’000
Year ended 31 July 2015
Revenue from external customers
108,679 465,420
51,636
1,949
2,290
11,630 641,604
Intersegment revenue
37,758
–
–
6,152
2,100
(46,010)
–
Total revenue
146,437 465,420
51,636
8,101
4,390
(34,380)
641,604
Regular profit/(loss) before income tax
209,290
31,546
(9,967)
4,866
9,251
(41,897)
203,089
Non-regular items before tax (note 3b)
23,957
(79,880)
(88,563)
–
–
–
(144,486)
Profit/(loss) before income tax
233,247
(48,334)
(98,530)
4,866
9,251
(41,897)
58,603
Less income tax benefit/(expense)
(28,773)
14,898
24,884
(296)
(831)
7,069
16,951
Profit/(loss) after tax
204,474
(33,436)
(73,646)
4,570
8,420
(34,828)
75,554
Less loss/(profit) attributable to
non-controlling interests
(4,687)
13,493
–
–
(1,030)
–
7,776
Profit/(loss) after tax attributable
to members
199,787
(19,943)
(73,646)
4,570
7,390
(34,828)
83,330
Profit/(loss) after tax attributable
to members (as above)
199,787
(19,943)
(73,646)
4,570
7,390
(34,828)
83,330
Non-regular loss/(profit) after tax attributable
to members (note 3b)
(19,648)
35,066
63,657
–
–
–
79,075*
Regular profit/(loss) after tax
attributable to members
180,139
15,123
(9,989)
4,570
7,390
(34,828)
162,405*
Profit/(loss) before income tax includes
the following items:
Interest revenue
43,803
230
11
163
109
–
44,316
Interest (expense)
(1,595)
(1)
(825)
–
(642)
–
(3,063)
Depreciation and amortisation (expense)
(2,267)
(61,181)
(16,675)
(16)
(104)
–
(80,243)
Impairment (expense)/reversal
42,189
(79,880)
(86,110)
–
–
–
(123,801)
Share of results from equity
accounted associates
90,122
–
(249)
–
3,156
2,050
95,079
*
The results for 2015 has been restated by transferring expenses of $5.956 million from regular profit to non-regular items
following a reallocation by an Associated Entity.