


 9 / 136

Chairman’s Review
7
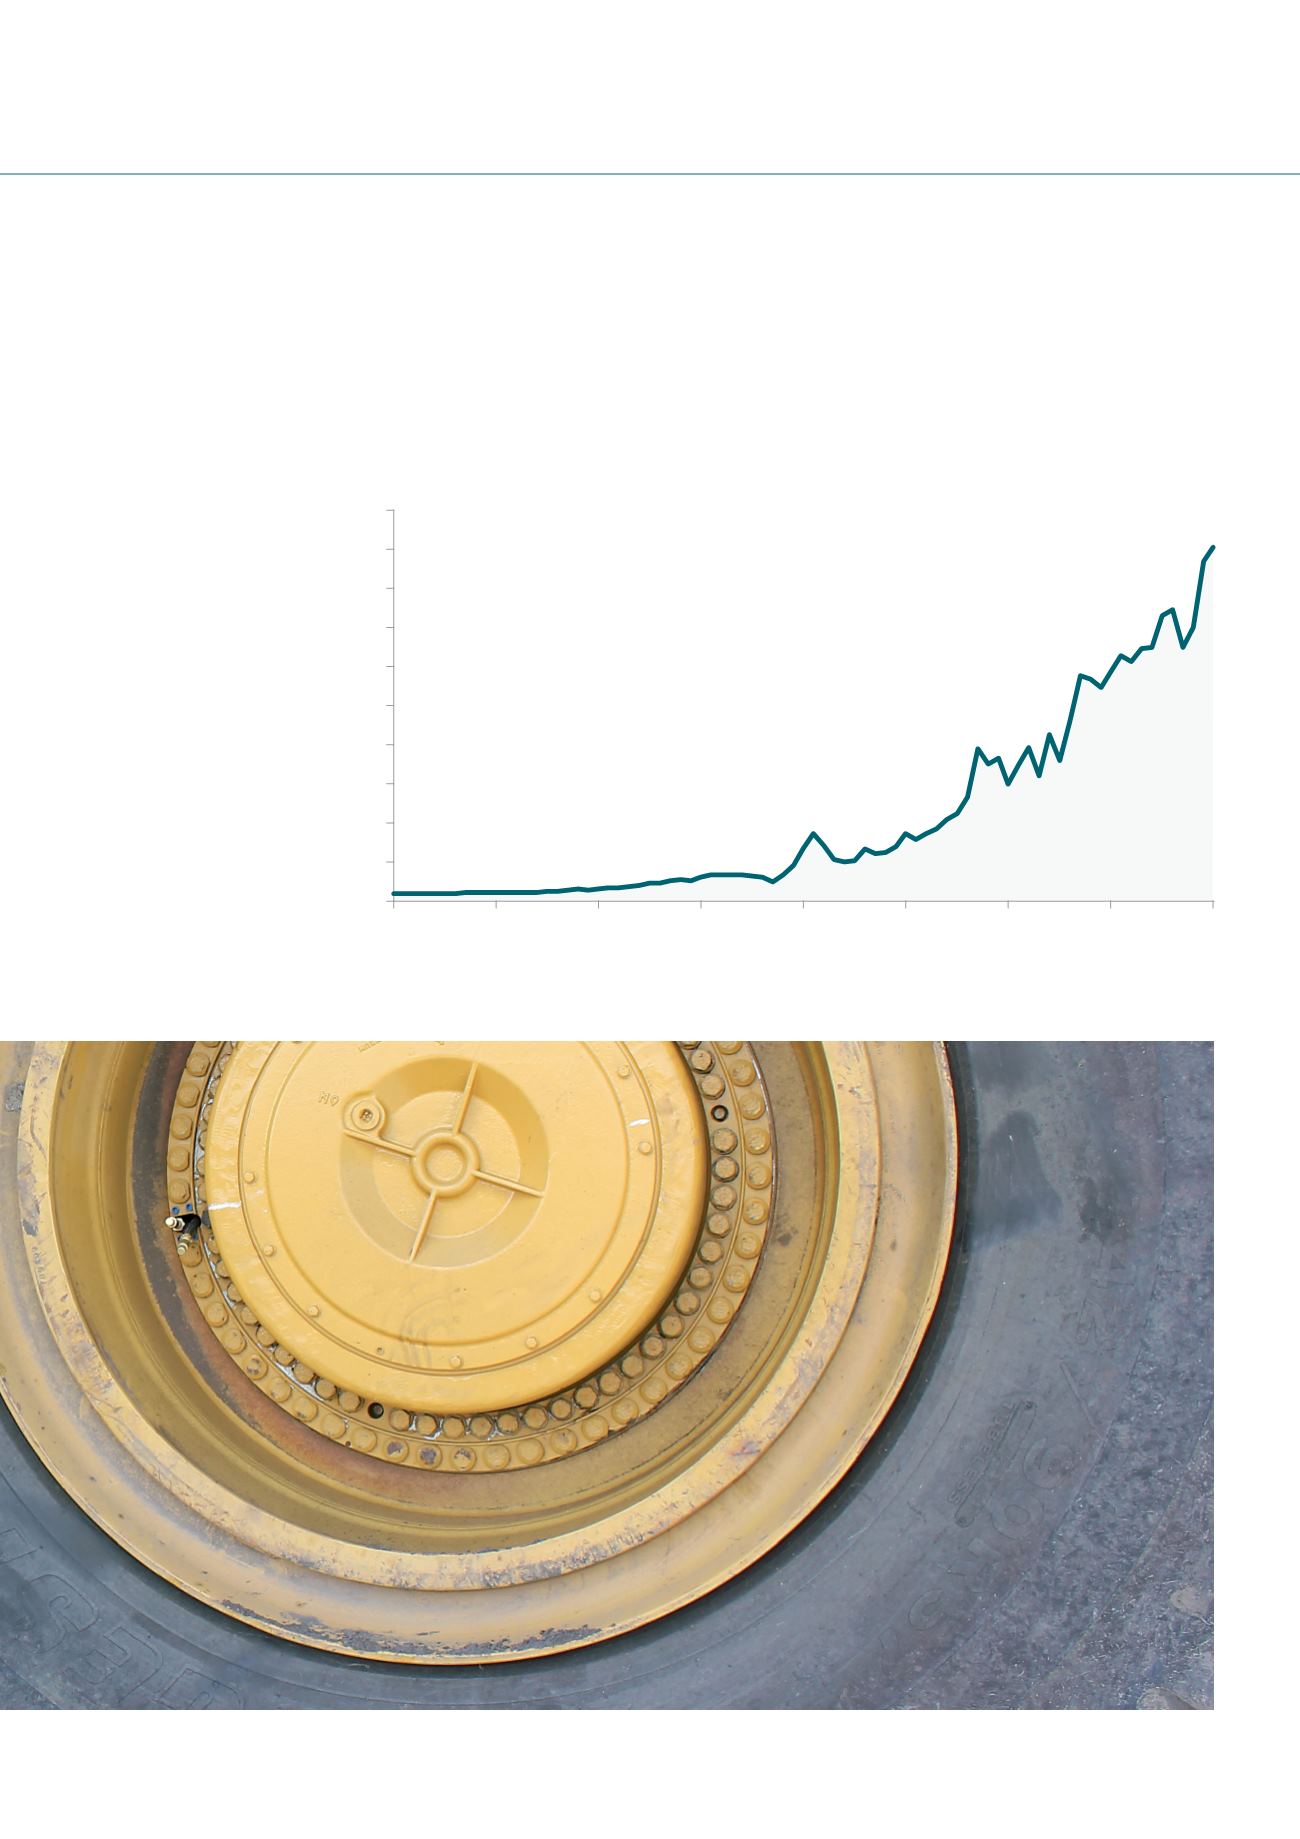
The following chart shows that the wealth creation is even more pronounced over a longer period.
If a shareholder had invested $1,000 in 1976 and reinvested all dividends, the shareholding would have
appreciated to nearly $454,000 as at 31 July 2016. This equates to a compound annual growth rate of 16.6%
year on year for 40 years.
Wealth Creation over 40 years
1976
1981
1986
1991
1996
2001
2006
2011
2016
$0
$50,000
$100,000
$150,000
$200,000
$250,000
$300,000
$350,000
$400,000
$450,000
$500,000
4
$1,000 invested in 1976 worth
$453,801
in 2016
4
Compound annual return of
16.6%
for 40 years
New Hope Group