



 9 / 12

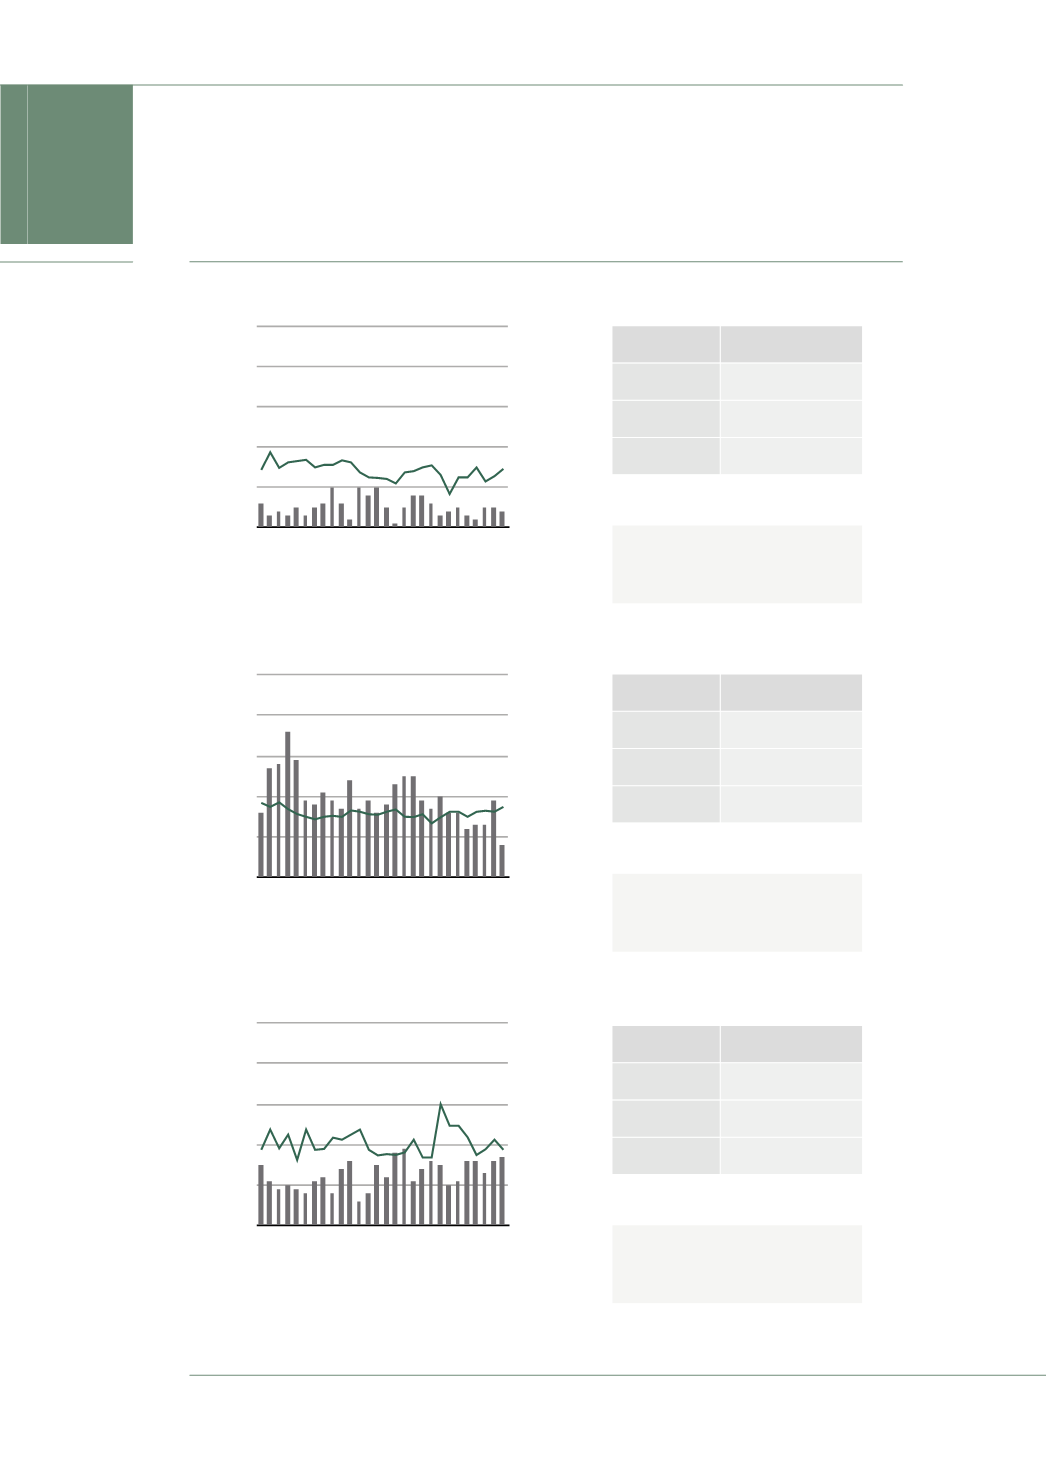
Yeronga
0
0.4
0.8
1.2
1.6
2.0
Q2 2008
Q1 2009
Q4 2009
Q3 2010
Q2 2011
Q1 2012
Q4 2012
Q3 2013
Q2 2014
Q1 2015
0
10
20
30
40
50
2 Bedroom House Segment
Median Price ($m)
Supply to Market
0
0.4
0.8
1.2
1.6
2.0
Q2 2008
Q1 2009
Q4 2009
Q3 2010
Q2 2011
Q1 2012
Q4 2012
Q3 2013
Q2 2014
Q1 2015
0
10
20
30
40
50
3 Bedroom House Segment
Median Price ($m)
Supply to Market
0
0.4
0.8
1.2
1.6
2.0
Q2 2008
Q1 2009
Q4 2009
Q3 2010
Q2 2011
Q1 2012
Q4 2012
Q3 2013
Q2 2014
Q1 2015
0
10
20
30
40
50
4 Bedroom House Segment
Median Price ($m)
Supply to Market
March Quarter 2015 © Ashton Rowe Pty Ltd 2015
Report provided exclusively to Belle Property
B U Y I N G PAT T E R N S
QUARTILE SOLD PRICES
UPPER
$372,000
MEDIAN
$365,000
LOWER
$360,000
SNR = Statistically Not Reliable
Supply to market decreased
20% taking it 23% below the 7
year average.
Source: Ashton Rowe Investments, RP Data and Price Finder
Source: Ashton Rowe Investments, RP Data and Price Finder
Source: Ashton Rowe Investments, RP Data and Price Finder
QUARTILE SOLD PRICES
UPPER
$595,000
MEDIAN
$529,950
LOWER
$470,000
SNR = Statistically Not Reliable
Supply to market decreased
58% taking it 59% below the 7
year average.
QUARTILE SOLD PRICES
UPPER
$1,075,000
MEDIAN
$815,000
LOWER
$687,500
SNR = Statistically Not Reliable
Supply to market increased 6%
taking it 34% above the 7 year
average.
NOTE:
Properties in the
house market are
divided into
segments based
on the number of
bedrooms.
To interpret this
page correctly
please view
instructions in the
‘Market Overview’
section.
TIP:
When buying to
renovate, aim to
purchase in the
lowest quartile
when supply to
market is above
the long term
average.
LEARNING
:
Statistically Not
Reliable
is usually
a result of not
enough sales
occurring to
produce
meaningful
analysis.
y