


 10 / 12

Chapel Hill
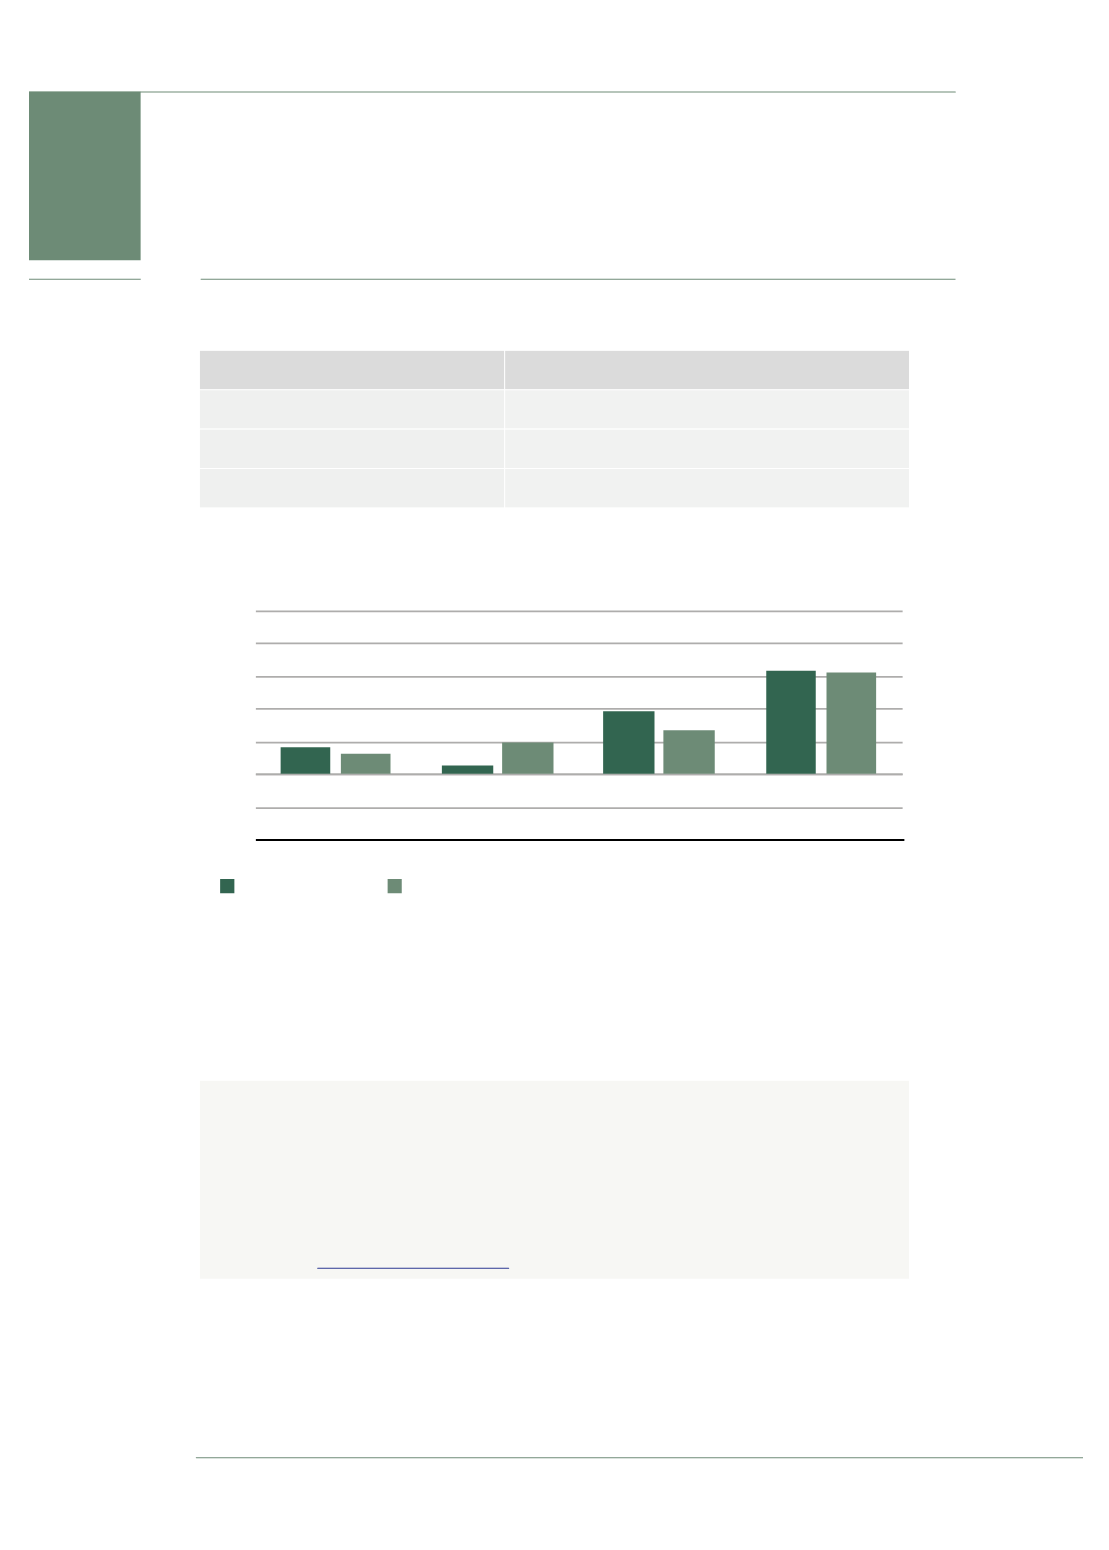
The Chapel Hill residential market has outperformed the Brisbane metropolitan market by an
average of 0.1% each year over the last three years for houses.
September Quarter 2015 © Ashton Rowe Pty Ltd 2015
Report provided exclusively to Belle Property
C A P I TA L G R OW T H
Source: Ashton Rowe Investments and Residex Suburb Report June 2015
*Rolling 12 month periods to quarter end
LEARNING:
Previously, the
only way to
measure a suburb’s
capital growth was
to compare the
median sale price
of properties sold
in one period with
the median sale
price of properties
sold in the next
period. This
however is
plagued with
problems. To
explain, if in one
quarter there were
many property
sales at the lower
end of the market
and in the next
quarter, there
were more sales at
the high end, this
would show a
large increase in
median price, but
would not reflect
actual capital
growth. Therefore,
median price best
represents buying
patterns.
SUBURB GROWTH
HOUSES
10 YEAR AVERAGE*
4.0%
3 YEAR AVERAGE*
5.0%
12 MONTHS**
9.7%
Source: Ashton Rowe Investments and Residex - Suburb Report June 2015
*Annualised capital growth **Capital growth over the last 12 months
Capital Growth Calculation:
In short, the calculation methodology takes “sale pairs” for
every property that has at least two sales recorded. These individual property growth
rates are then combined into a complete growth rate for the chosen suburb. The
development of this methodology won an international actuarial award in 1992. More
recently, a paper issued by the Reserve Bank of Australia (Australian House Prices: A
Comparison of Hedonic and Repeat-sales Measures, James Hansen, 2006) confirmed this
methodology to be superior to those based on simple movements in median price.
For more visit
www.ashtonrowe.com.auSource: Ashton Rowe Investments and Residex
STEP 1:
Choose your
property market.
STEP 2:
View the top
table to see the
medium to long
term capital
growth of the
suburb.
STEP 3:
View the graph
to see how the
suburb has
performed
against the wider
Brisbane region.
-10%
-5%
-0%
5%
10%
15%
20%
25%
Sep 2013
Sep 2014
Sep 2015
Total
Houses - Capital Growth
Chapel Hill Houses
Brisbane Houses