


 4 / 12

Chapel Hill
ASHTON ROWE IS ONE OF AUSTRALIA’S LEADING PROPERTY RESEARCH AND
INVESTMENT FIRMS, SPECIALISING IN RESIDENTIAL PROPERTY.
0
0.4
0.8
1.2
1.6
2.0
Q4 2008
Q3 2009
Q2 2010
Q1 2011
Q4 2011
Q3 2012
Q2 2013
Q1 2014
Q4 2014
Q3 2015
0
20
40
60
80
100
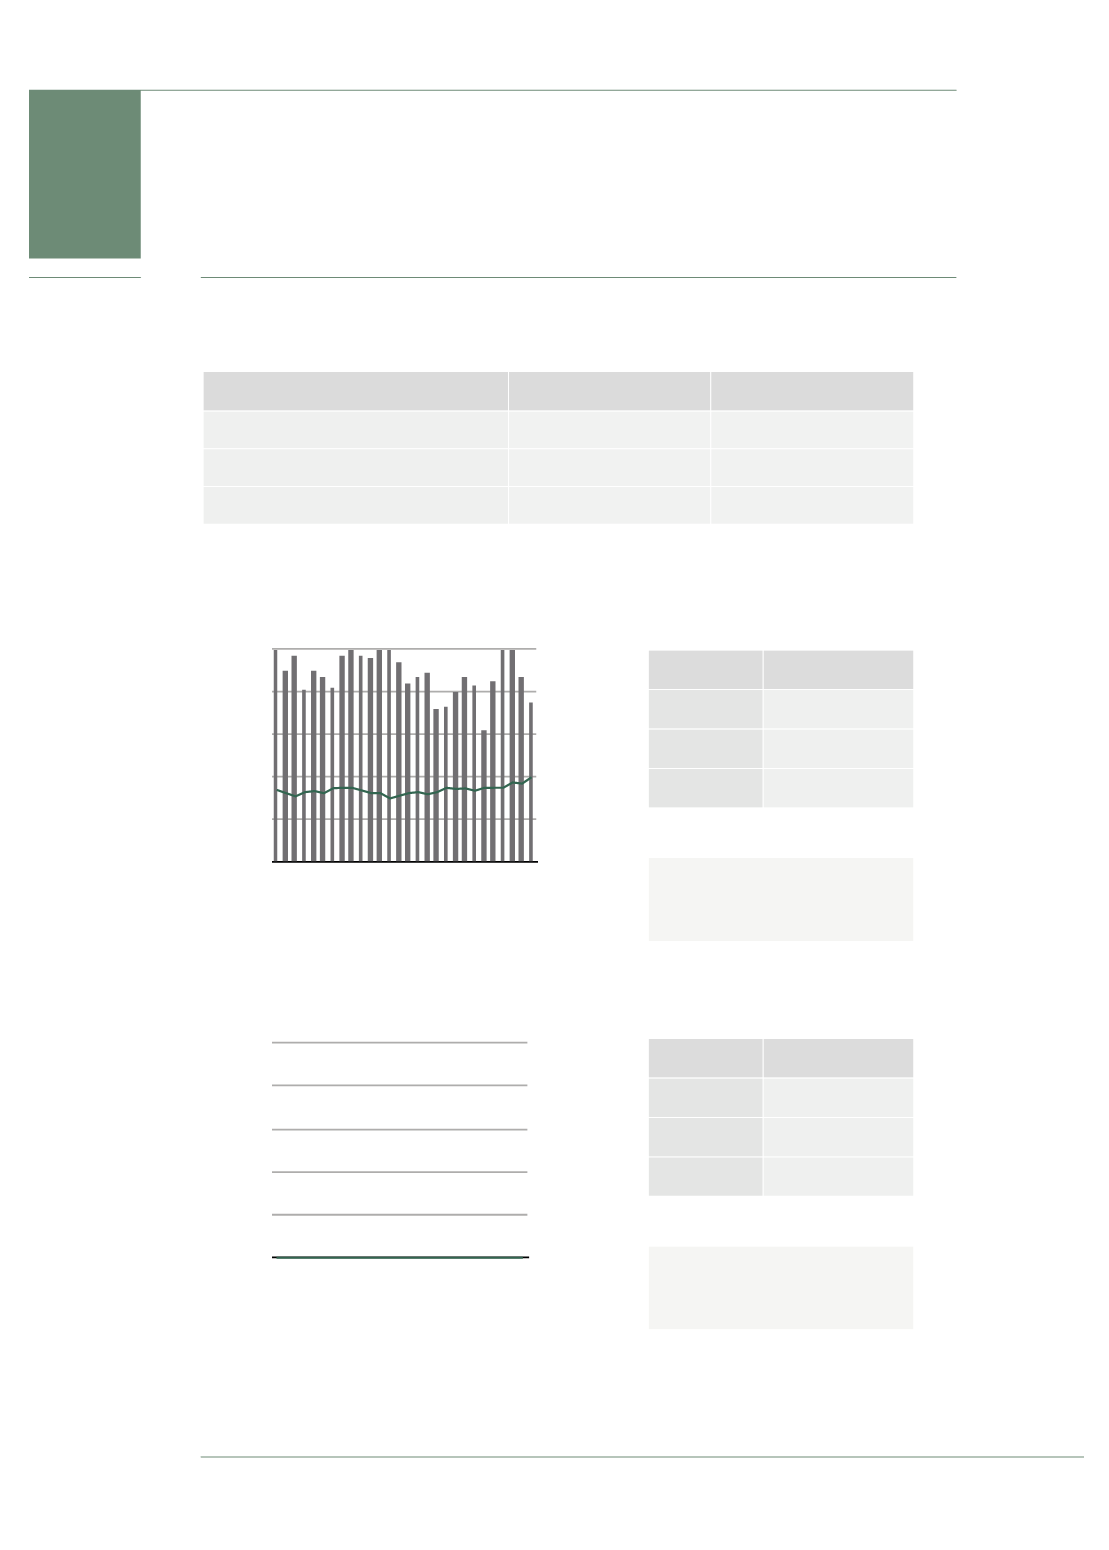
Total Houses
Median Price ($m)
Supply to Market
0
0.2
0.4
0.6
0.8
1.0
Q4 2008
Q3 2009
Q2 2010
Q1 2011
Q4 2011
Q3 2012
Q2 2013
Q1 2014
Q4 2014
Q3 2015
0
20
40
60
80
100
Total Units
Median Price ($m)
Supply to Market
September Quarter 2015 © Ashton Rowe Pty Ltd 2015
Report provided exclusively to Belle Property
TOTAL MARKET
HOUSES
UNITS
PROPERTIES IN SUBURB
3,522
103
SEPTEMBER QUARTER SALES*
32
2
TURNOVER
0.91%
1.94%
Source:: Australian Bureau of Statistics, Census 2011 and local council dwelling approvals
* 5% margin for error in this figure due to market information being with held.
M A R K E T O V E R V I E W
Source: Ashton Rowe Investments, RP Data and Price Finder
Source: Ashton Rowe Investments, RP Data and Price Finder
STEP 1: Choose
your property
market (houses or
units).
STEP 2: The top
table shows how
many properties
are changing
hands.
STEP 3: The graph
shows the median
listing price trends
and property on
the market
historically
(supply).
STEP 4: The table
next to the graph
shows the price
groups of
properties
actually sold in the
last quarter.
STEP 5: The
bottom table next
to the graph
shows what the
current supply
trend is for the
market. Less
supply when
demand is good
typically places
upward pressure
on prices.
QUARTILE SOLD PRICES
UPPER
$875,500
MEDIAN
$731,000
LOWER
$613,750
SNR = Statistically Not Reliable
Supply to market decreased
14% taking it 17% below the 7
year average.
QUARTILE SOLD PRICES
UPPER
SNR
MEDIAN
SNR
LOWER
SNR
SNR = Statistically Not Reliable
This market is too small to
analyse properly.
GUIDE:
Read these
snippets to
interpret the
report.
LEARNING:
Turnover
is the
number of
quarterly sales
divided by total
properties in that
market.
Median price
is
the middle price
of all properties
after they have
been arranged
from smallest to
highest. It best
represents trends
and buying
patterns NOT
capital growth.
Quartiles
divide
recent sales into
four equal groups.
25% of sales are
more than the
upper quartile.
50% of sales are
more than the
median and 75%
are more than the
lower quartile.
Finally, 50% of
sales are between
the upper and
lower quartiles.
Properties that
are priced above
the upper quartile
are typically more
volatile than those
priced close to the
median.