


 88 / 216

84
Copyright © 3P Learning – These resources have been created in partnership with Dr. Marian Small.
For more information visit
www.mathletics.comHundred Chart
Questions to facilitate the learning
•
What makes your pattern a pattern?
•
Suppose you coloured half the numbers. What might the chart look like? How are the numbers you
coloured alike?
•
Suppose you wanted only up-and-down lines in your pattern. What would your pattern look like? What would
those numbers have in common?
Scaffolding the learning
•
How far apart are numbers that are right above or below each other?
•
Suppose you coloured all the numbers in one vertical line. What is true about all of them?
•
Where are all the numbers that have a 2 in them somewhere?
What’s the point of this task?
The organisation of the numbers from 1 to 100 in a 10 by 10 chart has the potential to reveal many
properties of numbers. For example, if students colour all the numbers that end in 0, they see the pattern
of a vertical line; that’s because the numbers are 10 apart. But if they colour all the numbers that are 9
apart, they see the pattern of diagonal lines; that’s because 9 more is 1 less than 10 more. If students
colour all the even numbers, they see stripes.
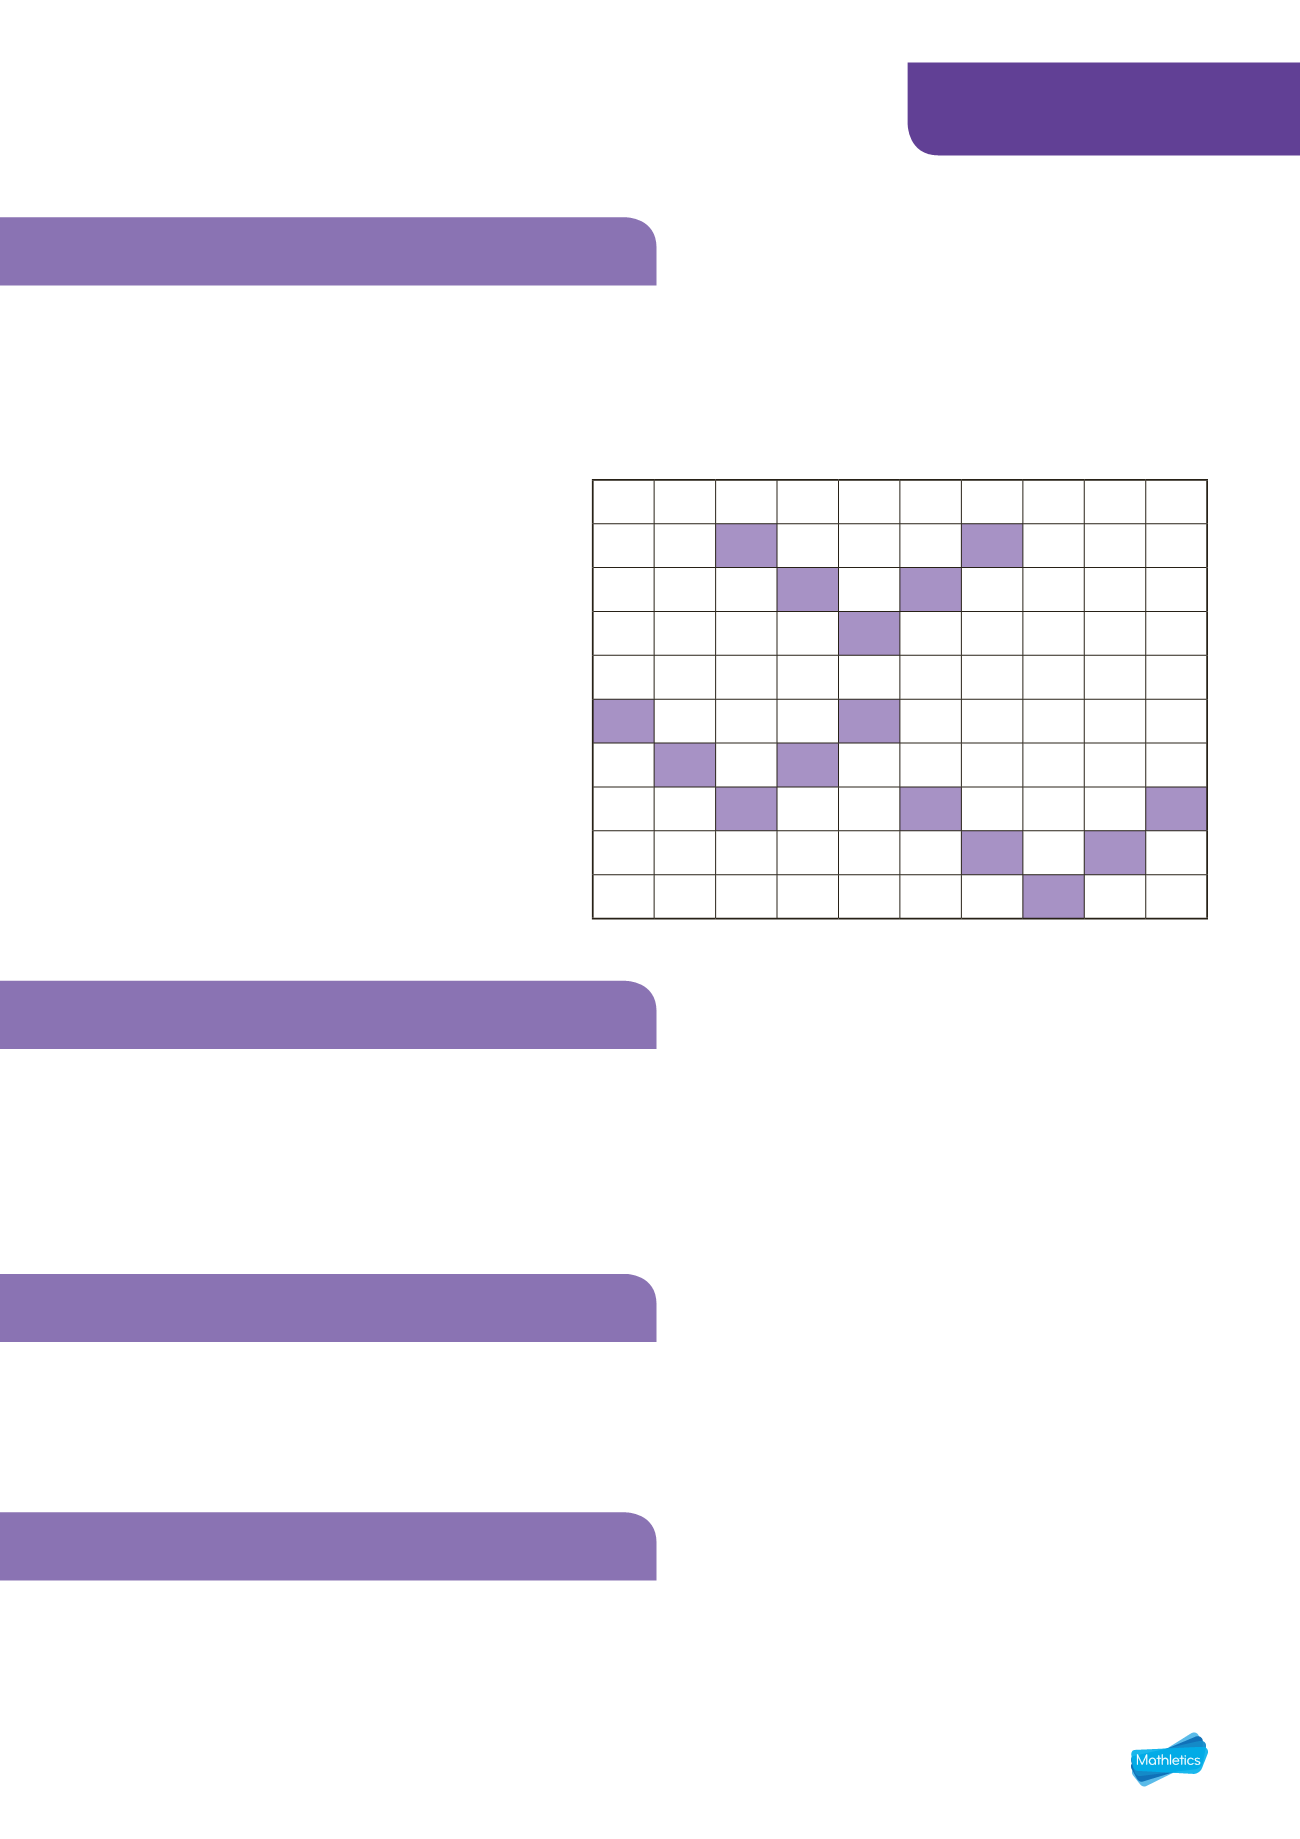
Students could start with a visual pattern
(instead of starting with a number pattern)
and see how the numbers also form a pattern.
For example, if they colour the pattern on the
right, they will see that within each ‘V’, the top
numbers are 18 and 22 less than the bottom
number and the middle numbers are 9 and 11
less than the bottom number and if you add
the numbers on the left, you end up with 6 less
than if you add the numbers on the right.
The rule for the pattern should be up to the
student. It could be every so many numbers, it
could be colour red, then blue, then blue, then
red, then blue, then blue, over and over or it
could be something like the one above that
includes sets of a ‘design’, like the V.
Extending the learning
Students might use a 100 chart that is arranged in rows of 5 or 20 instead of rows of 10 and see how
their same patterns play out on this new chart.
1
2 3 4 5 6 7 8 9 10
11
12 13 14 15 16 17 18 19 20
21 22 23 24 25 26 27 28 29 30
31 32 33 34 35 36 37 38 39 40
41 42 43 44 45 46 47 48 49 50
51 52 53 54 55 56 57 58 59 60
61 62 63 64 65 66 67 68 69 70
71 72 73 74 75 76 77 78 79 80
81 82 83 84 85 86 87 88 89 90
91 92 93 94 95 96 97 98 99 100
Patterns