


 22 / 60

22
|
CENTRAL COAST
REGIONAL SNAPSHOT
2016
Changes in Industry Composition
Total Workforce
The number of people in the workforce in Central Coast NSW
increased by 5,931 between 2009/10 and 2014/15.
The largest changes in the jobs held by the workforce between
2009/10 and 2014/15 in Central Coast NSW were for those
employed in:
• Other Services (+3,160 persons)
• Education and Training (+2,933 persons)
• Health Care and Social Assistance (+1,657 persons)
• Public Administration and Safety (-1,063 persons)
Full-time equivalent workforce
The number of people in the full-time equivalent workforce in
Central Coast NSW increased by 1,121 between 2009/10 and
2014/15.
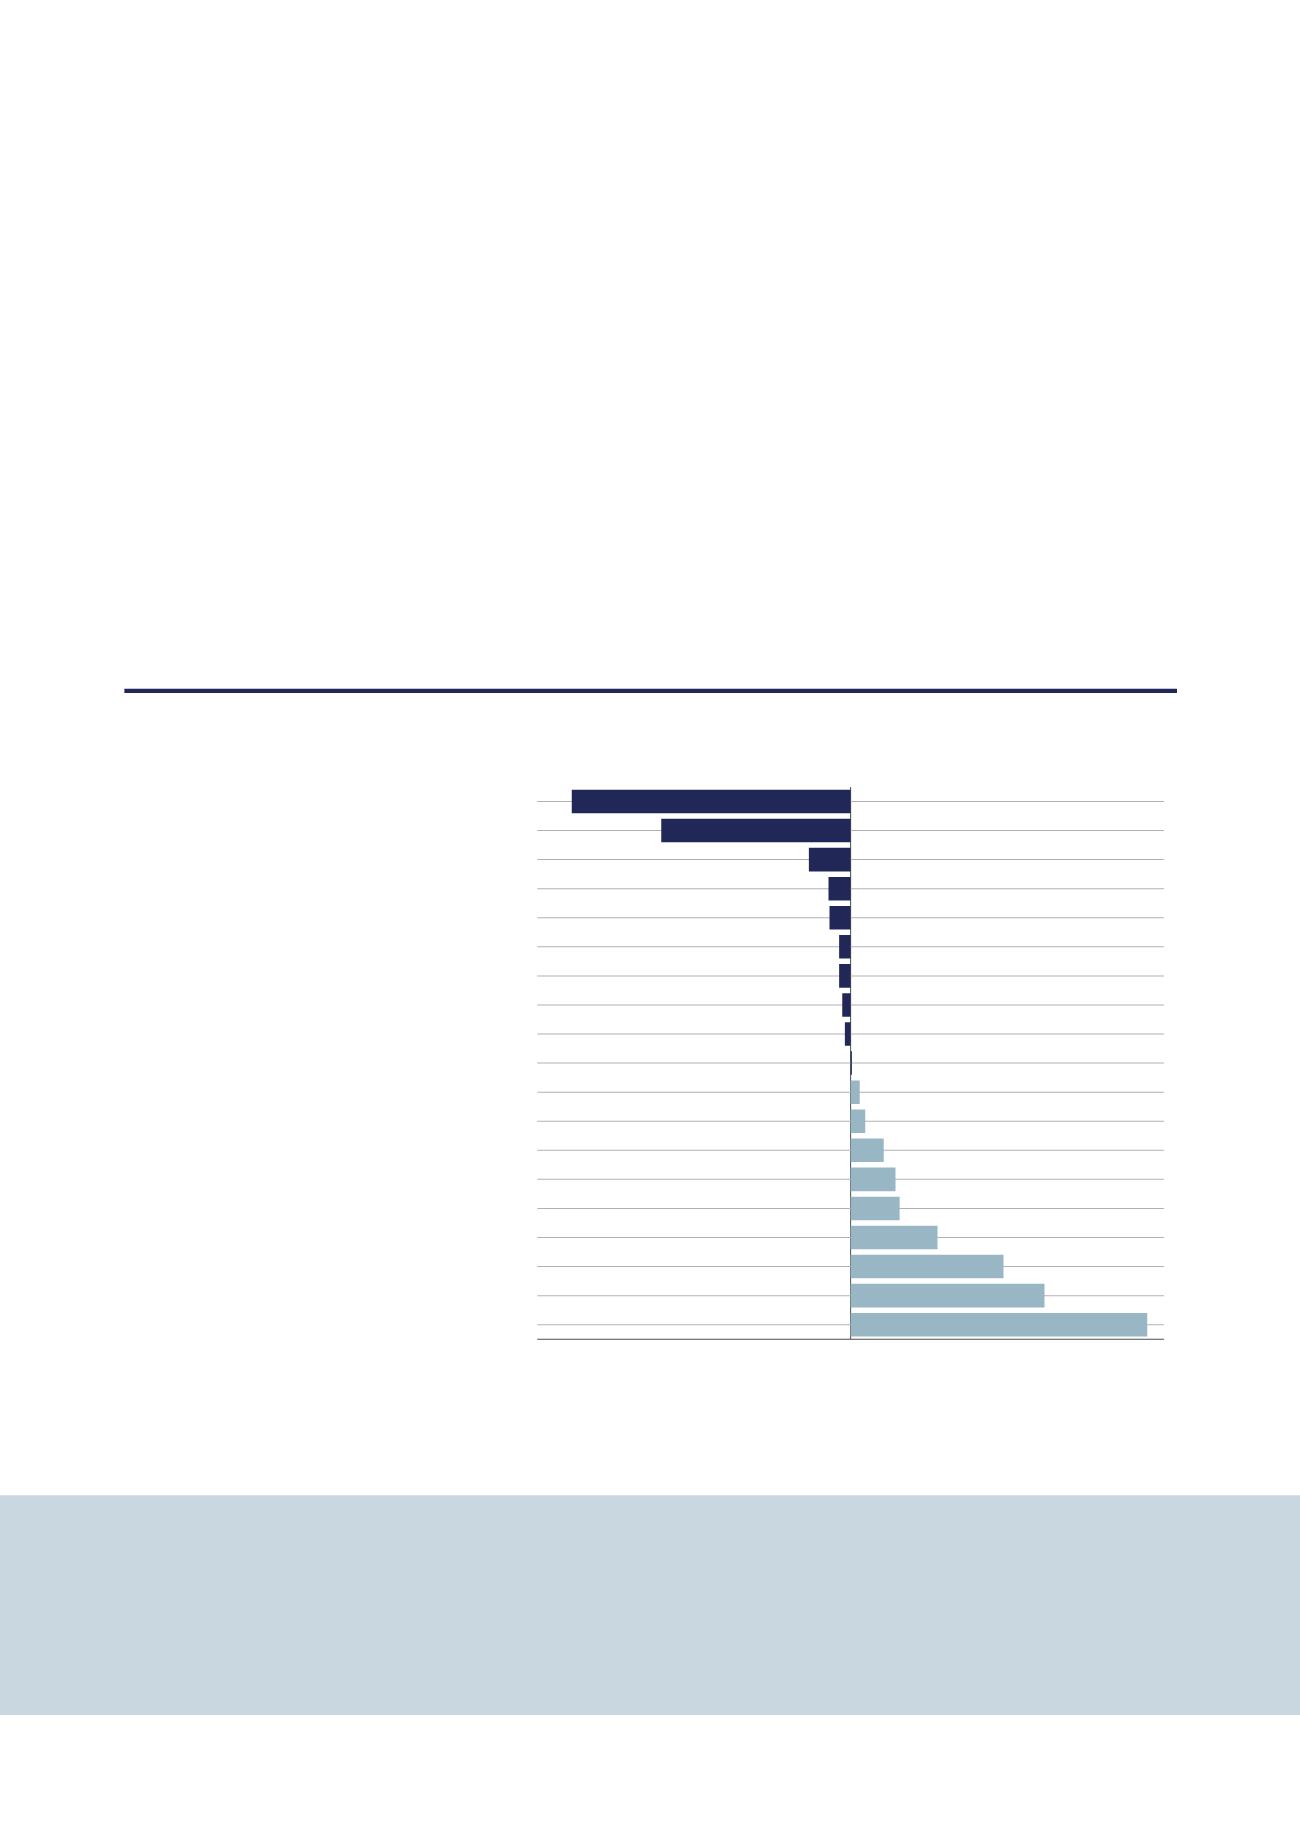
The largest changes in the jobs held by the full-time equivalent
workforce between 2009/10 and 2014/15 in Central Coast
NSW were for those employed in:
• Accommodation and Food Services (+1,137 FTEs)
• Manufacturing (-1,069 FTEs)
• Health Care and Social Assistance (+743 FTEs)
• Construction (-726 FTEs)
Sustainable Communities and Population Growth
The full-time equivalent workforce in Central Coast NSW
increased by 1,121 between 2009/10 and 2014/15
CHANGE IN EMPLOYMENT (FTE) 2009/10 TO 2014/15
-1200
-800
-400
0
400
800
1200
Accommodation and Food Services
Health Care and Social Assistance
Information Media and Telecommunications
Arts and Recreation Services
Other Services
Education and Training
Administrative and Support Services
Public Administration and Safety
Electricity, Gas, Water and Waste Services
Financial and Insurance Services
Transport, Postal and Warehousing
Mining
Agriculture, Forestry and Fishing
Wholesale Trade
Rental, Hiring and Real Estate Services
Professional, Scientific and Technical Services
Retail Trade
Construction
Manufacturing
Change in number of employed (fte)
SOURCE:
NIEIR 2016