


 26 / 60

26
|
CENTRAL COAST
REGIONAL SNAPSHOT
2016
Business Analysis
Analysis of the business numbers by industry sector indicates
that there are 20,915 registered businesses on the Central Coast
with the Construction industry had the largest number of total
registered businesses in Central Coast NSW, comprising 22.6%
of all total registered businesses, compared to 15.4% in
New South Wales.
Registered business by industry shows how many businesses
there are in Central Coast NSW within each industry sector using
the Australian Bureau of Statistics (ABS) Business Register which
itself is derived from the GST register held by the Australian Tax
Office (ATO). Businesses are included if they are registered with
the ATO, with an ABN used within the previous two financial years.
Businesses are split up between employing and non-employing
businesses. Non-employing businesses may include sole traders
and registered ABNs which are part of larger enterprises.
The distribution of businesses may reflect the industry structure
of the area, or may differ significantly. For instance, the largest
industry in an area may consist of one very large business, with a
large number of employees, while a sector with a lower value-
added could have a lot of small and micro businesses.
Also note that public sector institutions are not recorded which
has a significant impact on the numbers for Health Care,
Education and Public Administration and Safety.
Sustainable Communities and Population Growth
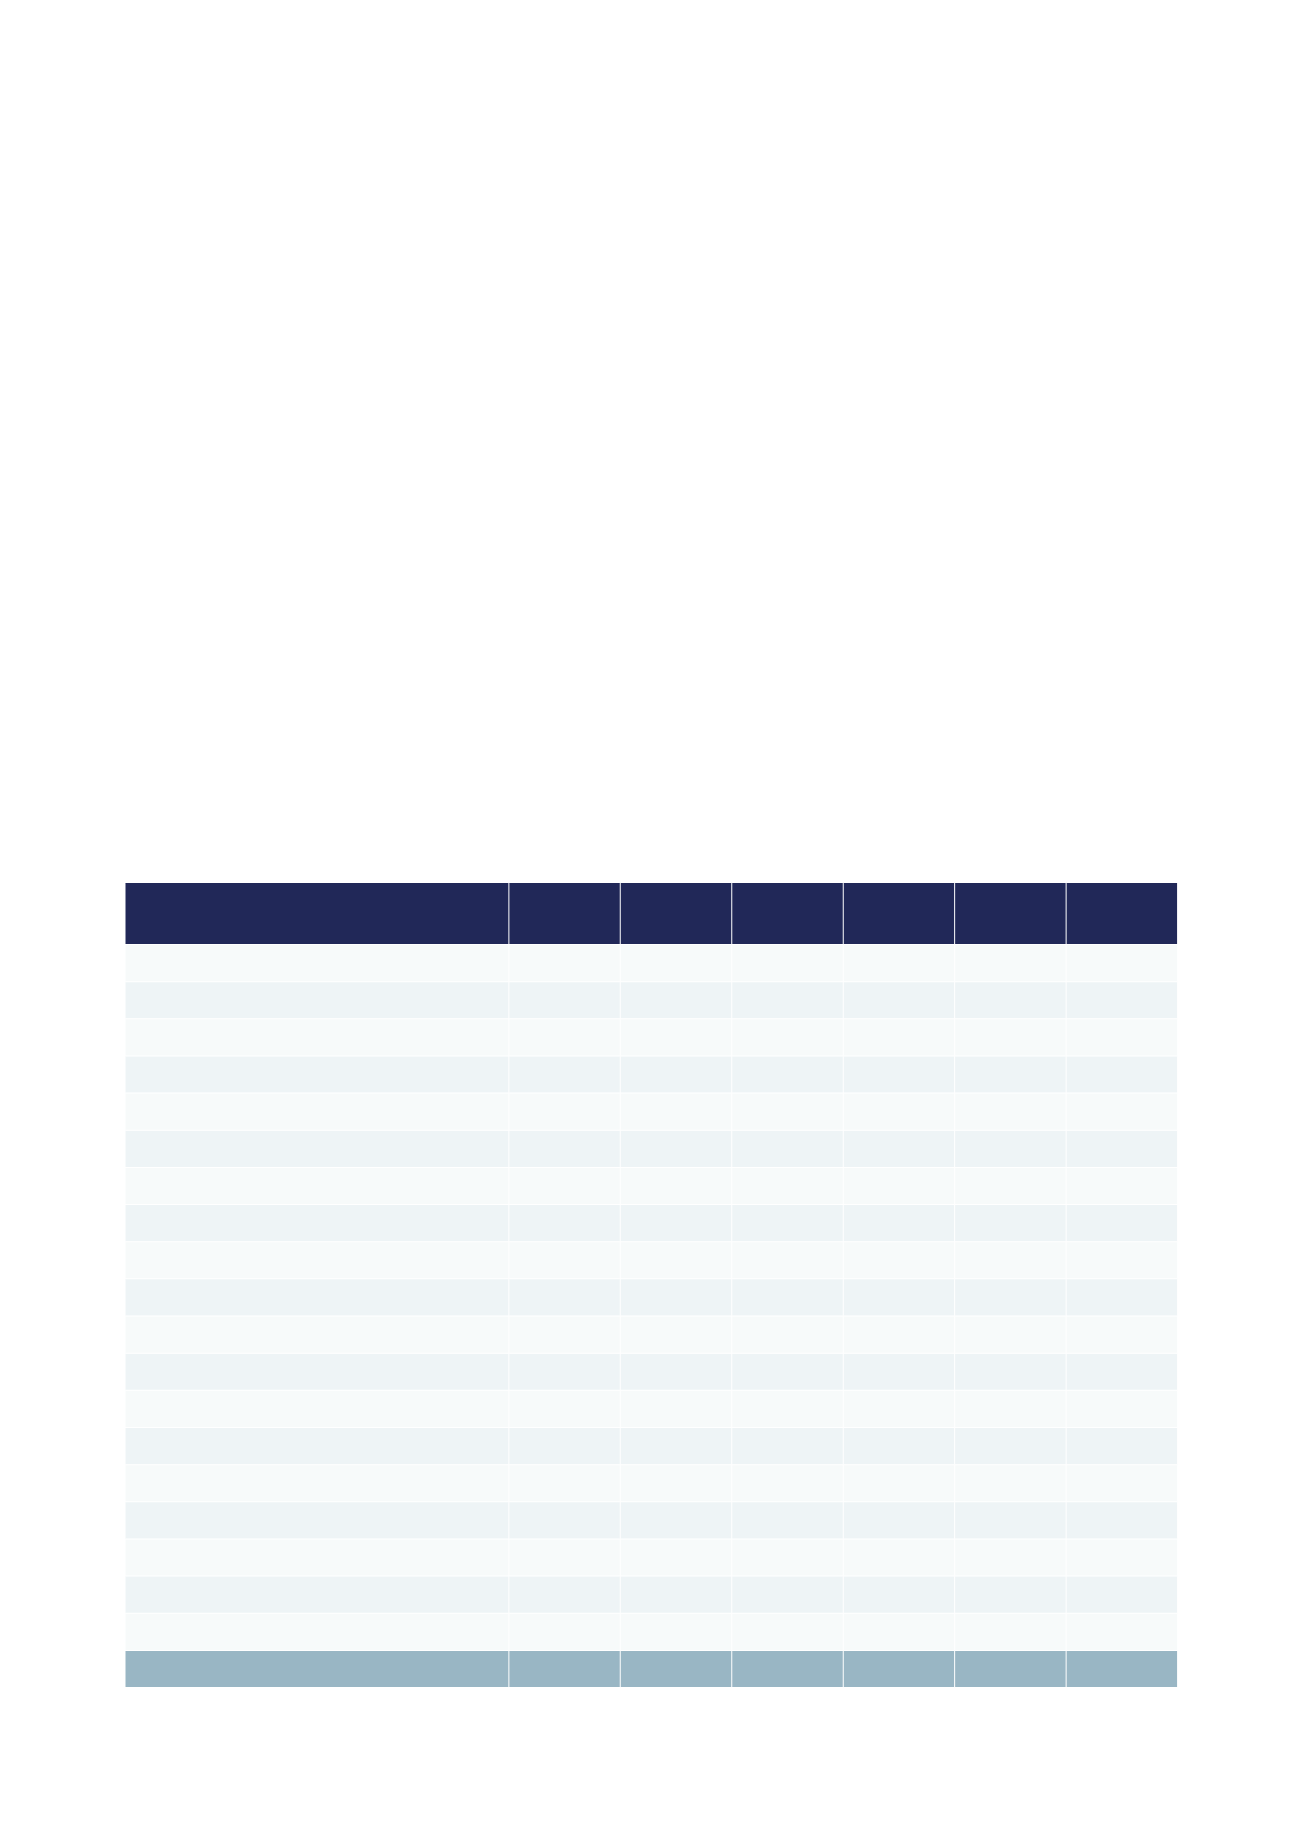
Number of employees per business
Analysis of the number of employees per business indicates that 55% of Central Coast businesses are non-employing businesses with
97.9% of all businesses employee less than 20 people.
Industry
Non-
Employing
2-4
5-19
20-199
200+
Total
Businesses
Agriculture. Forestry & Fishing
372
106
30
-
-
508
Mining
17
9
6
-
-
32
Manufacturing
361
298
176
58
3
896
Electricity, Gas, Water & Waste Services
34
30
18
0
3
85
Construction
2,442
1,886
345
47
-
4,720
Wholesale Trade
317
242
98
32
-
689
Retail Trade
578
541
256
59
-
1,434
Accommodation & Food services
212
343
277
84
3
919
Transport, Postal & Warehousing
592
355
42
8
-
997
Information Media & Telecommunications
124
65
6
6
-
201
Financial & Insurance Services
1,314
254
32
3
-
1,603
Rental, Hiring & Real Estate Services
1,678
308
118
6
-
2,110
Professional, Scientific & Technical Services
1,340
1,014
188
25
-
2,567
Administrative & Support Services
443
300
103
24
-
870
Public Administration & Safety
64
38
21
6
-
129
Education & Training
172
122
46
9
-
349
Health Care & Social Assistance
690
457
191
44
3
1,385
Arts & Recreation Services
216
77
39
8
-
340
Other Services
433
525
111
12
-
1,081
Total Business
11,399
6,970
2,103
431
12
20,915
NOTE: ‘Non-employing businesses’ includes sole proprietors where the proprietor does not receive a wage or salary separate to the business income.
SOURCE:
NIEIR (ABS 2011)