


 24 / 60

24
|
CENTRAL COAST
REGIONAL SNAPSHOT
2016
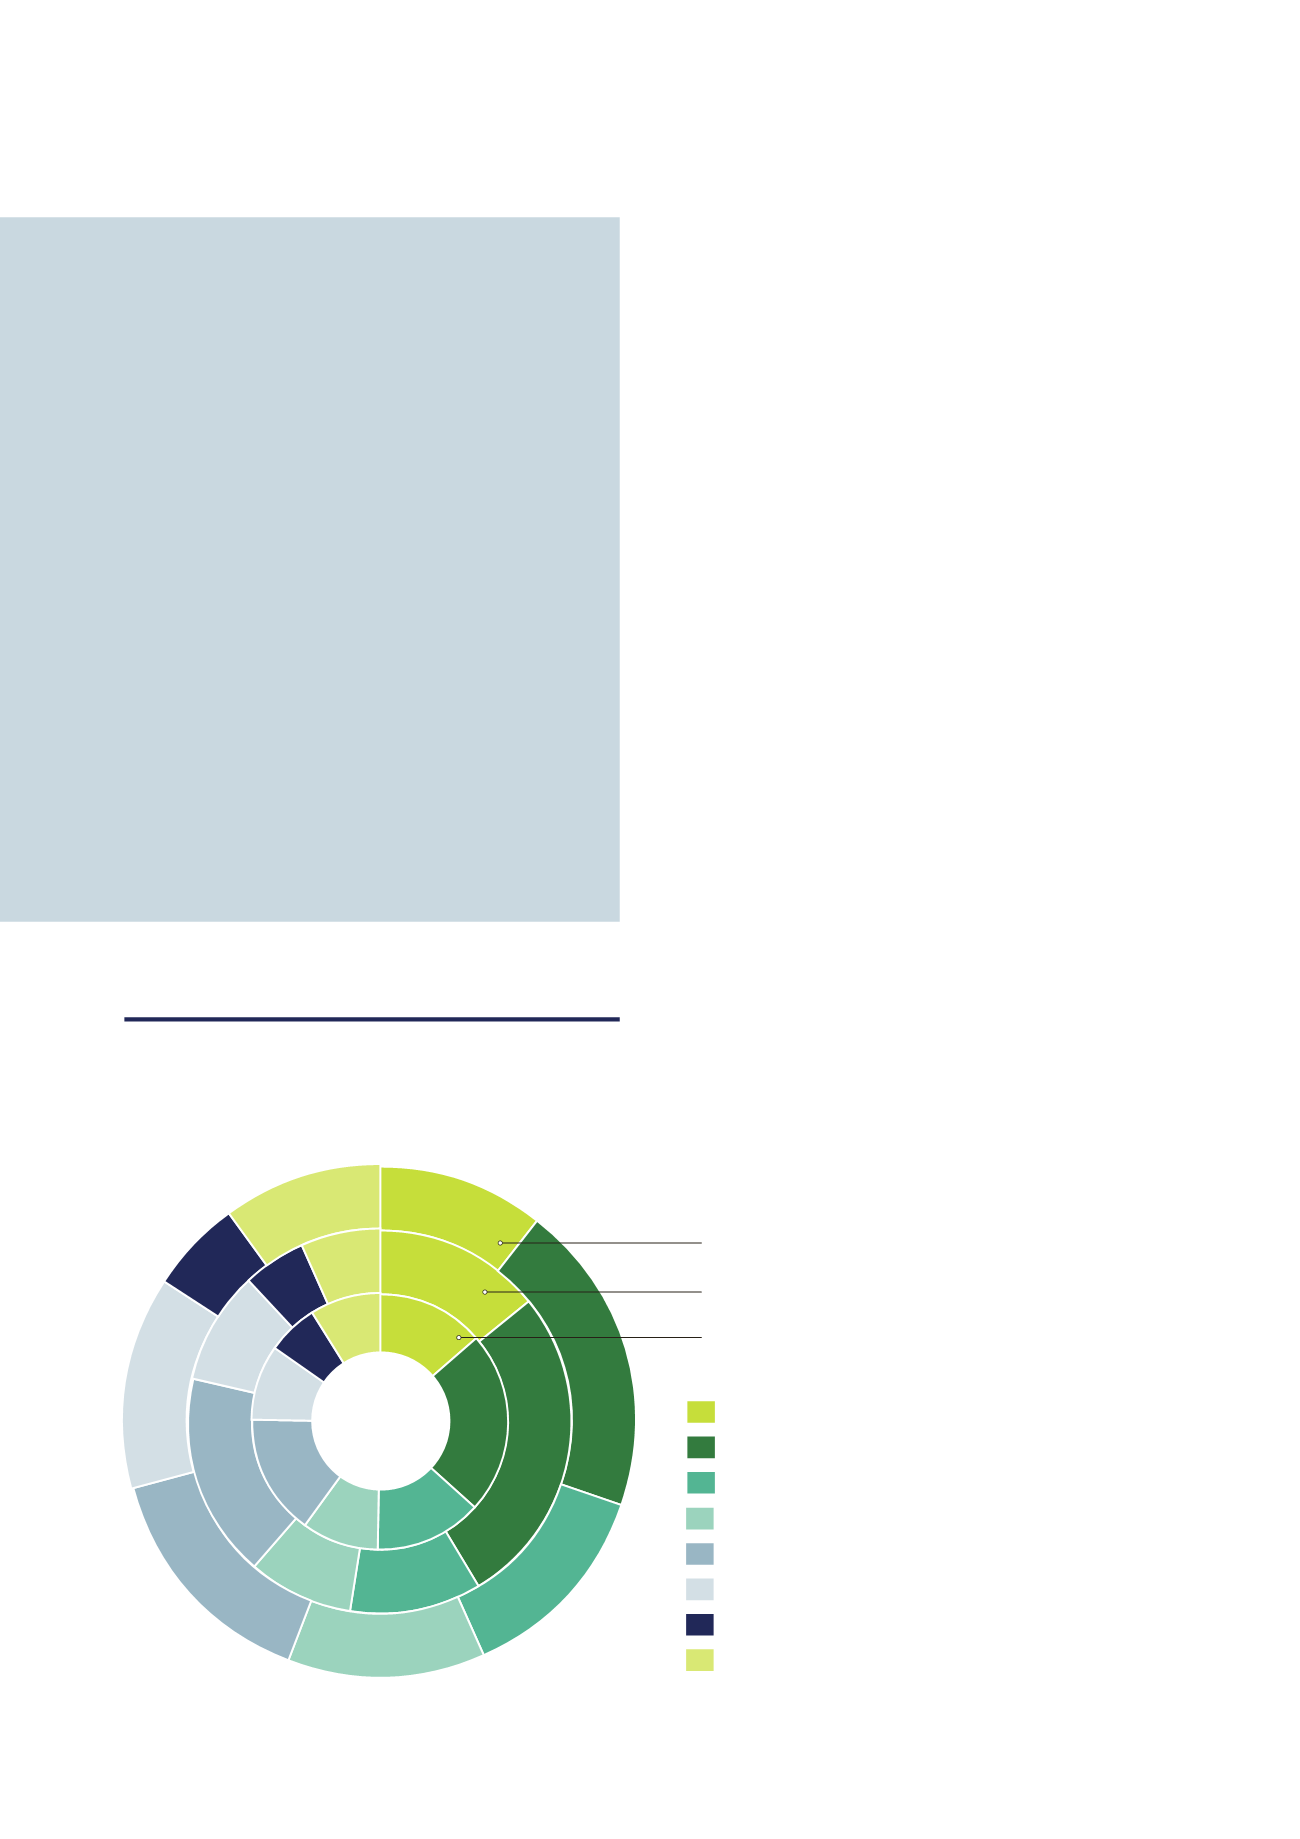
Workforce Occupations – All Industries
An analysis of the jobs held by the workforce in Central Coast
NSW in 2011 shows the three most popular occupations were:
• Professionals (17,734 people or 19.7%)
• Clerical and Administrative Workers
(13,381 people or 14.9%)
• Sales Workers (11,914 people or 13.2%)
In combination these three occupations accounted for 43,029
people in total or 47.8% of the workforce.
In comparison, New South Wales employed 23.0% as
Professionals; 15.2% as Clerical and Administrative Workers; and
9.4% as Sales Workers.
The major differences between the jobs held by the workforce
in Central Coast NSW and New South Wales were:
• A larger percentage of people employed as Sales Workers
(13.2% compared to 9.4%)
• A larger percentage of people employed as Community
and Personal Service Workers (12.3% compared to 9.6%)
• A smaller percentage of people employed as Professionals
(19.7% compared to 23.0%)
• A smaller percentage of people employed as Managers
(10.6% compared to 13.5%)
The largest changes in the jobs held by the workforce in
Central Coast NSW between 2006 and 2011 were:
• Professionals (+2,146 people)
• Community and Personal Service Workers (+1,755 people)
• Labourers (-520 people)
• Clerical and Administrative Workers (+425 people)
Sustainable Communities and Population Growth
WORKFORCE OCCUPATIONS
CENTRAL COAST COMPARED WITH NSW
Managers
Professionals
Technicians and Trades Workers
Community and Personal Service Workers
Clerical and Administrative Workers
Sales Workers
Machinery Operators and Drivers
Labourers
23.3%
13.3%
9.5%
6.4%
8.7%
13.7%
9.7%
15.4%
10%
6.5%
17.3%
15%
13.3%
9.3%
5.5%
19.8%
10.7%
13.1%
12.4%
8.9%
5.7%
11%
27.3%
14.2%
New South Wales
Greater Sydney
Central Coast
43.1%
of the workforce
worked part-time
SOURCE:
NIEIR (ABS 2011)