



 51 / 66

49
Comments:
•
Audited cases can have more than one clinical management issue identified for each patient. The percentage
of patients affected is the important measure.
•
Patients often require input from other clinical teams during their course of treatment. Management issues
may be attributable to any of these teams.
•
Assessors perceived that clinical management issues occurred in 34.1% (2,112/6,179) of cases.
•
A clinical management issue was identified that was attributed to the surgical team in 18.6% (1,152/6,179) of
cases. Clinical management issues were attributed to other clinical teams (e.g. medical and emergency
departments) in 5% of cases, to hospital issues in 1.1% of cases, and to other factors in 1.1% of cases. In
8.8% of cases the assessors did not identify the responsible team.
•
Assessors felt that clinical management issues probably contributed to death in 5.1% (316) of patients. In the
remaining cases in which management issues were perceived, the impact of those issues on the outcome
was uncertain. Assessors determined that the clinical management issues were definitely or probably
preventable in 19.1% (1,174) of patients with clinical issues.
•
These findings are similar to the national mortality audit results.
(7)
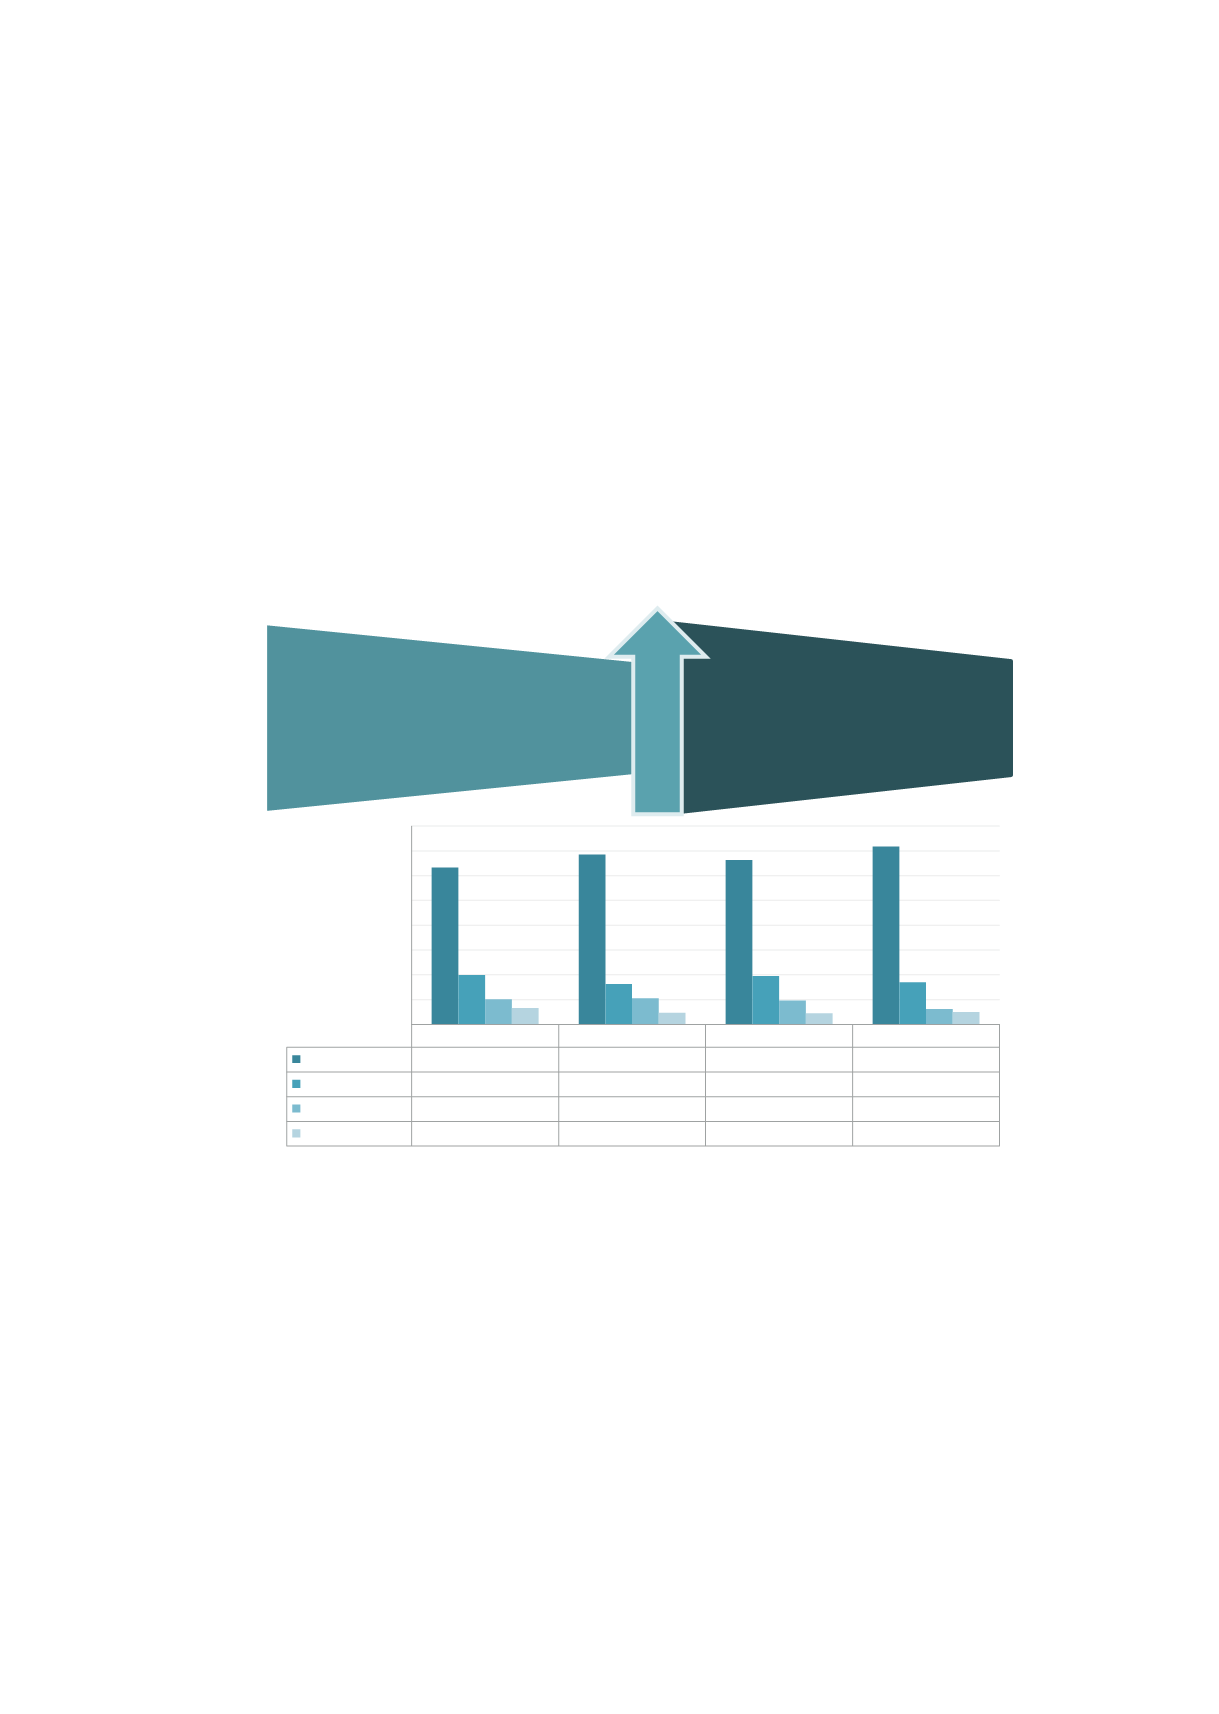
Figure 30: Trends of clinical management issues as assessed by assessors (FLA and SLA).
Note: total n=6,179.
Audit period 1 July 2007 to 30 June 2015.
Data not available: n=19 (<1%).
Comments:
•
There was a reduction in the rate of clinical issues over the 6-year audited period. In 2007–2012 there were
no clinical management issues identified in 63.3% (2,144/3,388) of patients. This figure rose to 71.8%
(544/772) in 2014–2015 (p<0.001).
•
Assessors perceived more clinical issues than treating surgeons. The issues identified by the treating
surgeons compared with the first-line assessor reached a concordance level of 77.3%. The gap widens
between the treating surgeon and the second-line assessor, with the level of concordance falling to only
58.2%. These results highlight the importance and value of an independent peer review assessment.
•
The prevalence of areas of concern and adverse events identified by assessors was similar among the
specialties. Some specialties have had few mortalities reported or recently commenced the audit process,
which may skew the data.
2007-2012
2012-2013
2013-2014
2014-2015
None
63.3%
68.5%
66.3%
71.8%
Consideration
19.9%
16.2%
19.5%
17.0%
Concern
10.2%
10.6%
9.7%
6.2%
Adverse event
6.6%
4.7%
4.5%
5.1%
0%
10%
20%
30%
40%
50%
60%
70%
80%
Issues (%)
66.1%
No issues
2007-2014
71.8%
No issues
2014-2015
Audit period