



 53 / 66

51
age
(28)
,comorbidities
(29)
, ASA status, gender, day of surgical admission relating to delay to surgery
(30)
, waiting
times
(17, 31, 32)
and reduction of theatre changeover time.
(33)
The attribution of delays were delay in patient care, delay in diagnosis, delay in fully investigating the patient,
delay in patient presenting, delay in recognising complications, delay in transfer to surgical unit, delay in
transfer to tertiary hospital, delay in starting medical treatment, delay to operation caused by missed diagnosis
and delay to surgery where earlier operation was desirable.
There was also criticism of the choice of operative procedure and decision to consider another operative
approach, or performing less extensive procedures on sicker patients with multiple comorbidities. The use of
open versus laparoscopic procedures carries a higher incidence of anastomotic leaks and transfusion
therefore is crucial in the choice of the operative procedure.
(34)
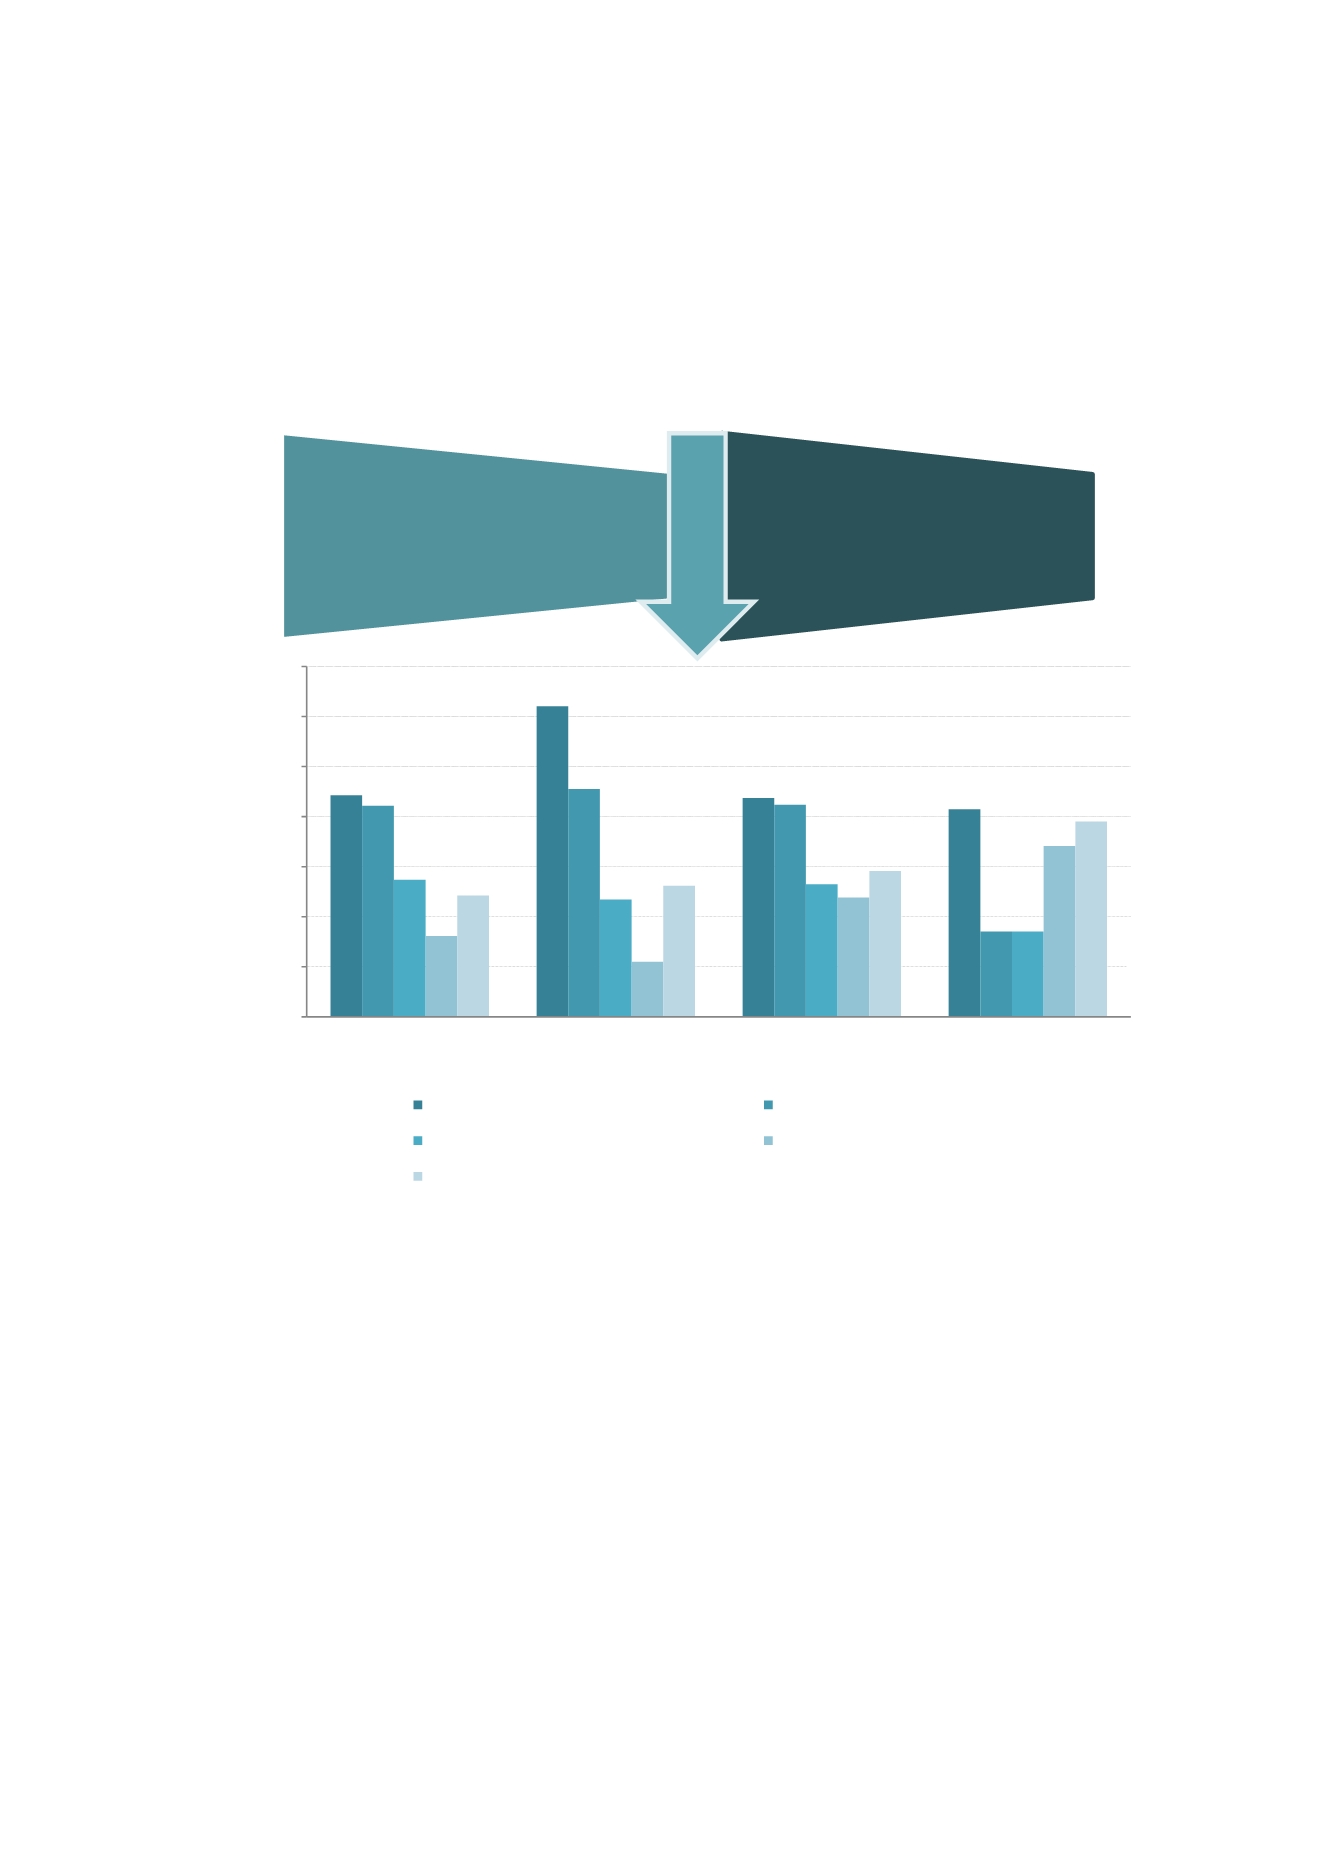
Figure 32: Trends in top five preventable clinical management issues in second-line assessments
Note: total n=947 clinical management issues identified as definitely or probably preventable in 1,052 second-line assessments.
Audit period 1 July 2007 to 30 June 2015.
More than one clinical management issue can be attributed to one case.
The clinical issues were re-categorised and detailed in the 2015 VASM Technical report.
Comments:
Operative management issues 23.3% (221) and delay issues 20.3% (192) were the most common preventable
clinical issues found in 947 instances.
Preventable delay issues saw the largest drop, falling from 25.0% (6/24) in 2007-2008 to 8.5% (7/82) in 2014-
2015. Preventable preoperative care issues also dropped dramatically between
2007-2008 12.5% (3/24
) to 2014-
2015 8.5% (7/82).
Preventable general complications of surgery had the largest rise, from 4.2% (1/24) in 2007-2008 to 6.1% (5/82) in
2014-2015.
Preventable protocol issues rose to 19.5% (16/82) in 2014-2015.
Ongoing review and monitoring of patient management is needed for preventable mortality.
(35)
0.0%
5.0%
10.0%
15.0%
20.0%
25.0%
30.0%
35.0%
2007-2012
2012-2013
2013-2014
2014-2015
Definitely or probably preventable (%)
Audit period
Operative management issues
Delay issues
Preoperative care issues
Protocol issues
Postoperative care issues
25.1%
Preventable operative management issues
2007-2014
20.7%
Preventable operative management issues
2014-2015