



 54 / 66

52
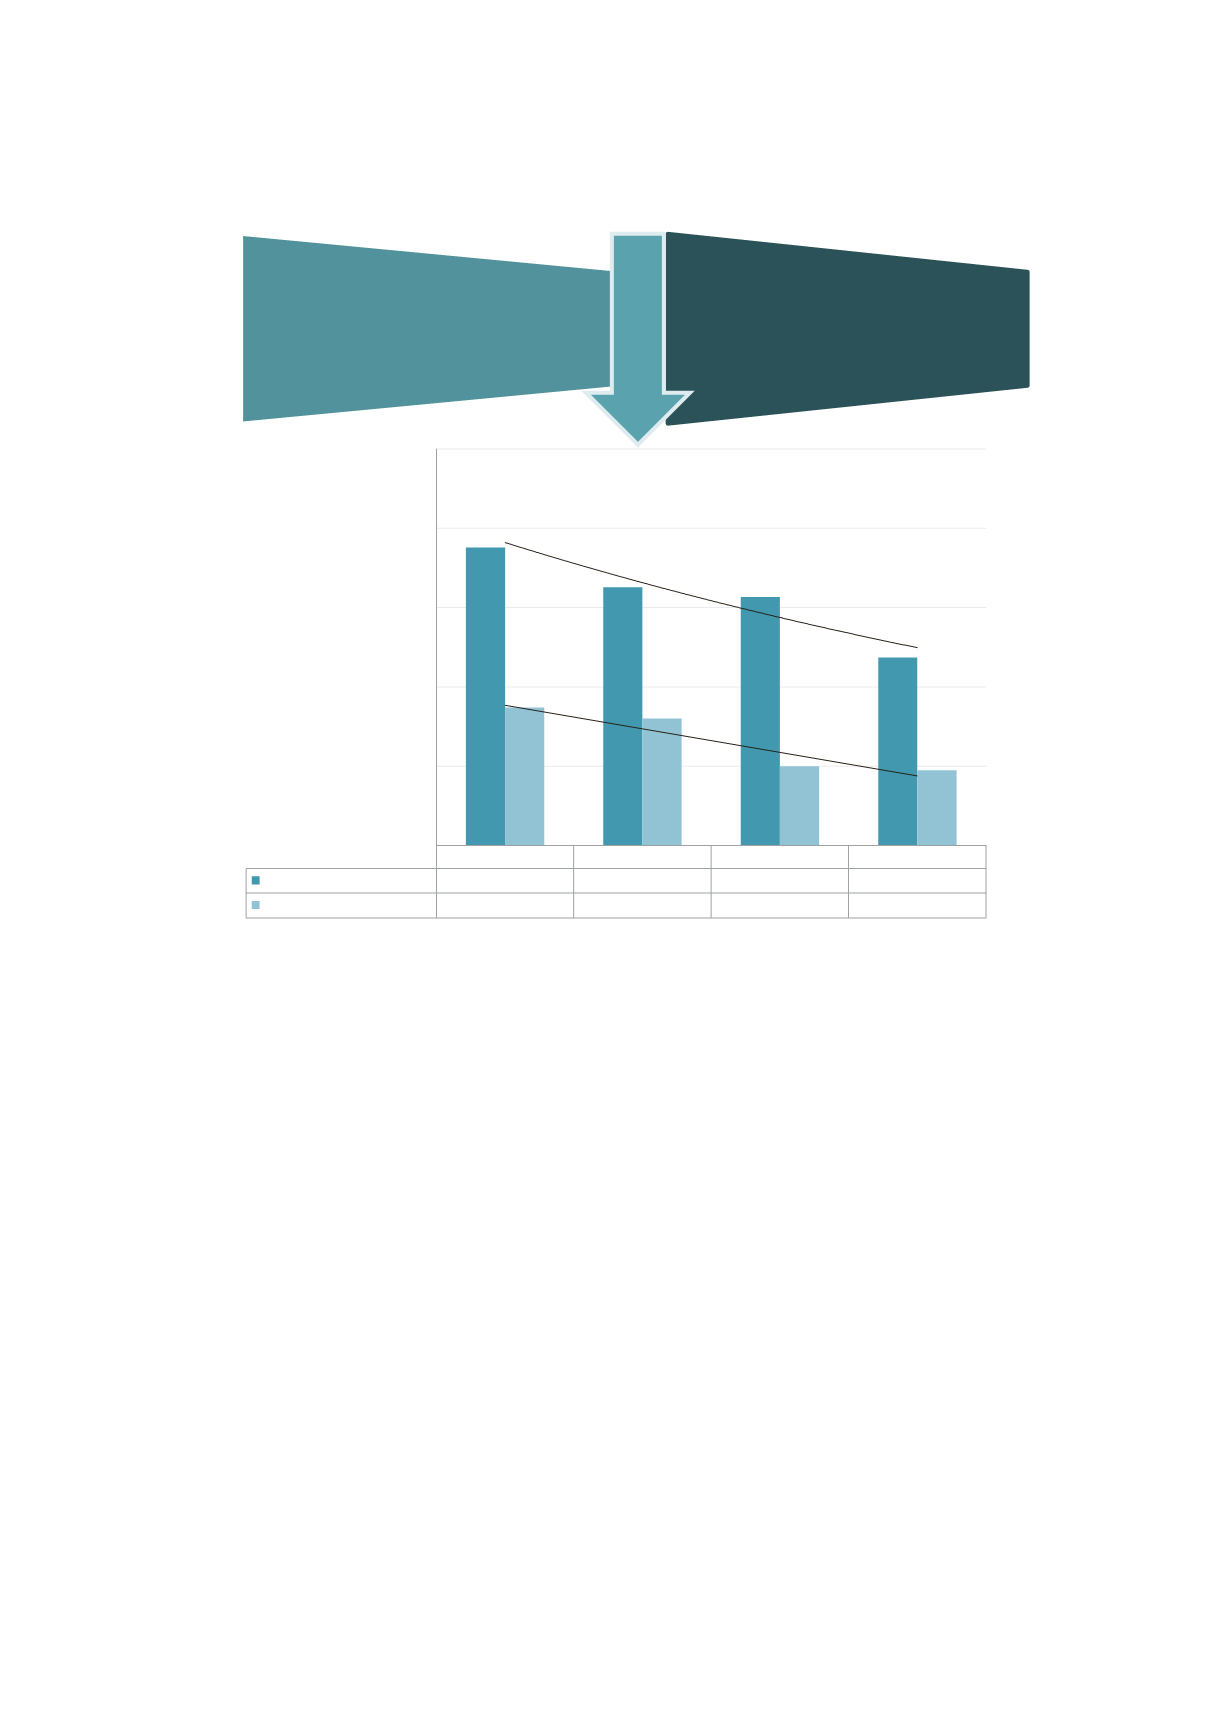
Figure 33 shows the frequency of adverse events and areas of concern by operative status.
Figure 33: Frequency of adverse events and areas of concern by operative status.
Note: total n=6,160.
Audit period 1 July 2007 to 30 June 2015.
Data not available: n=19 (<1%).
The operative and nonoperative power trend line indicates decreased adverse event and area of concern rates in both groups.
Comments:
•
Audited cases in which no operative procedure occurred had a significantly lower rate of areas of concern and
adverse events (7.6%; 78/992) than cases in which an operative procedure occurred (16.8%; 872/5,184).
•
There was a reduction in the frequency of areas of concern and adverse events, from 16.9% during the 2007–
2014 period to 11.9% in 2014–2015 (
p
<0.001).
2007-2012
2012-2013
2013-2014
2014-2015
Operative procedure
18.78%
16.28%
15.66%
11.85%
No operative procedure
8.70%
8%
5%
4.76%
0%
5%
10%
15%
20%
25%
Cases with adverse event and area of concern (%)
16.9%
AE and concern in operative cohort
2007-2014
11.9%
AE and concern in operative cohort
2014-2015
Audit period