


 55 / 68

Vol 5 No 5 October/November 2016
Australian Journal of Dementia Care
55
allows passive monitoring of the latitude
and longitude of the phone. This means it
can show where the phone is on a map.
This has been used by engineers at
CSIRO’s Australian ehealth Research
Centre and our team of health
researchers at the University of
Queensland to develop a custom
Lifespace app (Liddle
et al
2014).
The app keeps a record of the phone’s
location during a specified period and
calculates lifespace outcomes like daily
distance travelled, percentage of time
spent at home and number of trips into
the community. The user just needs to
carry the phone with them. As GPS is not
effective within buildings, small
bluetooth beacons can be placed within
the home to enable monitoring of the
phone’s position within the home.
Our team now has a study underway
in several Sydney suburbs measuring the
lifespace of people living with dementia
or mild cognitive impairment (MCI).
Users carry the phone for one week and
participate in an interview about their
community mobility experiences and
needs. Family members also participate
in an interview.
Preliminary results are giving insights
into the daily lives of this group, their
experiences of using the technology and
ways in which their current and future
community mobility needs could be met.
Sydney study of lifespace
Fifteen participants (nine men and six
women) to date have provided lifespace
data using the app. These participants
are aged between 81 and 90 years of age,
living either in the community with a
friend or family member (eight
participants), alone (five participants) or
in a low-care facility (two
participants).
Use of the phone app and the
beacons in the home have enabled
us to capture the lifespace in
numbers and visually. We are able to
measure distances travelled,
patterns and locations of activity in
a day and percentage of time spent
at home.
From the data collected so far,
participants spend between 65-99%
of their week at home. Their
lifespaces span between 0.08 and
1.93 sq km during the week. Most
participants do not leave the home
every day, with a range of 0-13 trips
(episodes of going into the
community) recorded over the one-
week period. The furthest distance
travelled in a day ranged from 26m
for one participant to 12.5km for
another.
An example image (translocated
to a different city to protect
anonymity) is below.
The study runs through to the end
of 2016 and as it progresses, the
measured lifespace is being
compared to reported community
mobility experiences and barriers, as
well as participants’ descriptions of
effective supports.
We will also be looking at how
lifespace relates to health and well-being
for people. In doing this, means of
identifying people needing support for
their lifespace, as well as ways of
supporting and enhancing lifespace will
be developed in the expectation that
these clinical interventions can be made
available through health and community
services in future.
Preliminary results from our analysis
of participants’ needs and experiences
appear to support the need for
individualised, meaningful and
multidisciplinary support (eg
occupational therapy, physiotherapy and
psychology) for community mobility.
This may range from support for safe
walking, to managing anxiety and
apathy that might prevent a person being
mobile, to learning about and choosing
the best transport options for chosen
community destinations and activities.
Existing interventions (like those for
driving cessation) may also be indicated.
Community mobility
experiences and needs
The participants in the study were also
interviewed about their community
mobility and needs. They described a
range of things that supported and
encouraged staying mobile including
lifetime habits; pleasant, safe walking
environments; friends and family going
with them; transport options and having
personally important things to do that
DCRC SPEC I AL I SSUE : THE B I G P I CTURE I N DEMENT I A RESEARCH
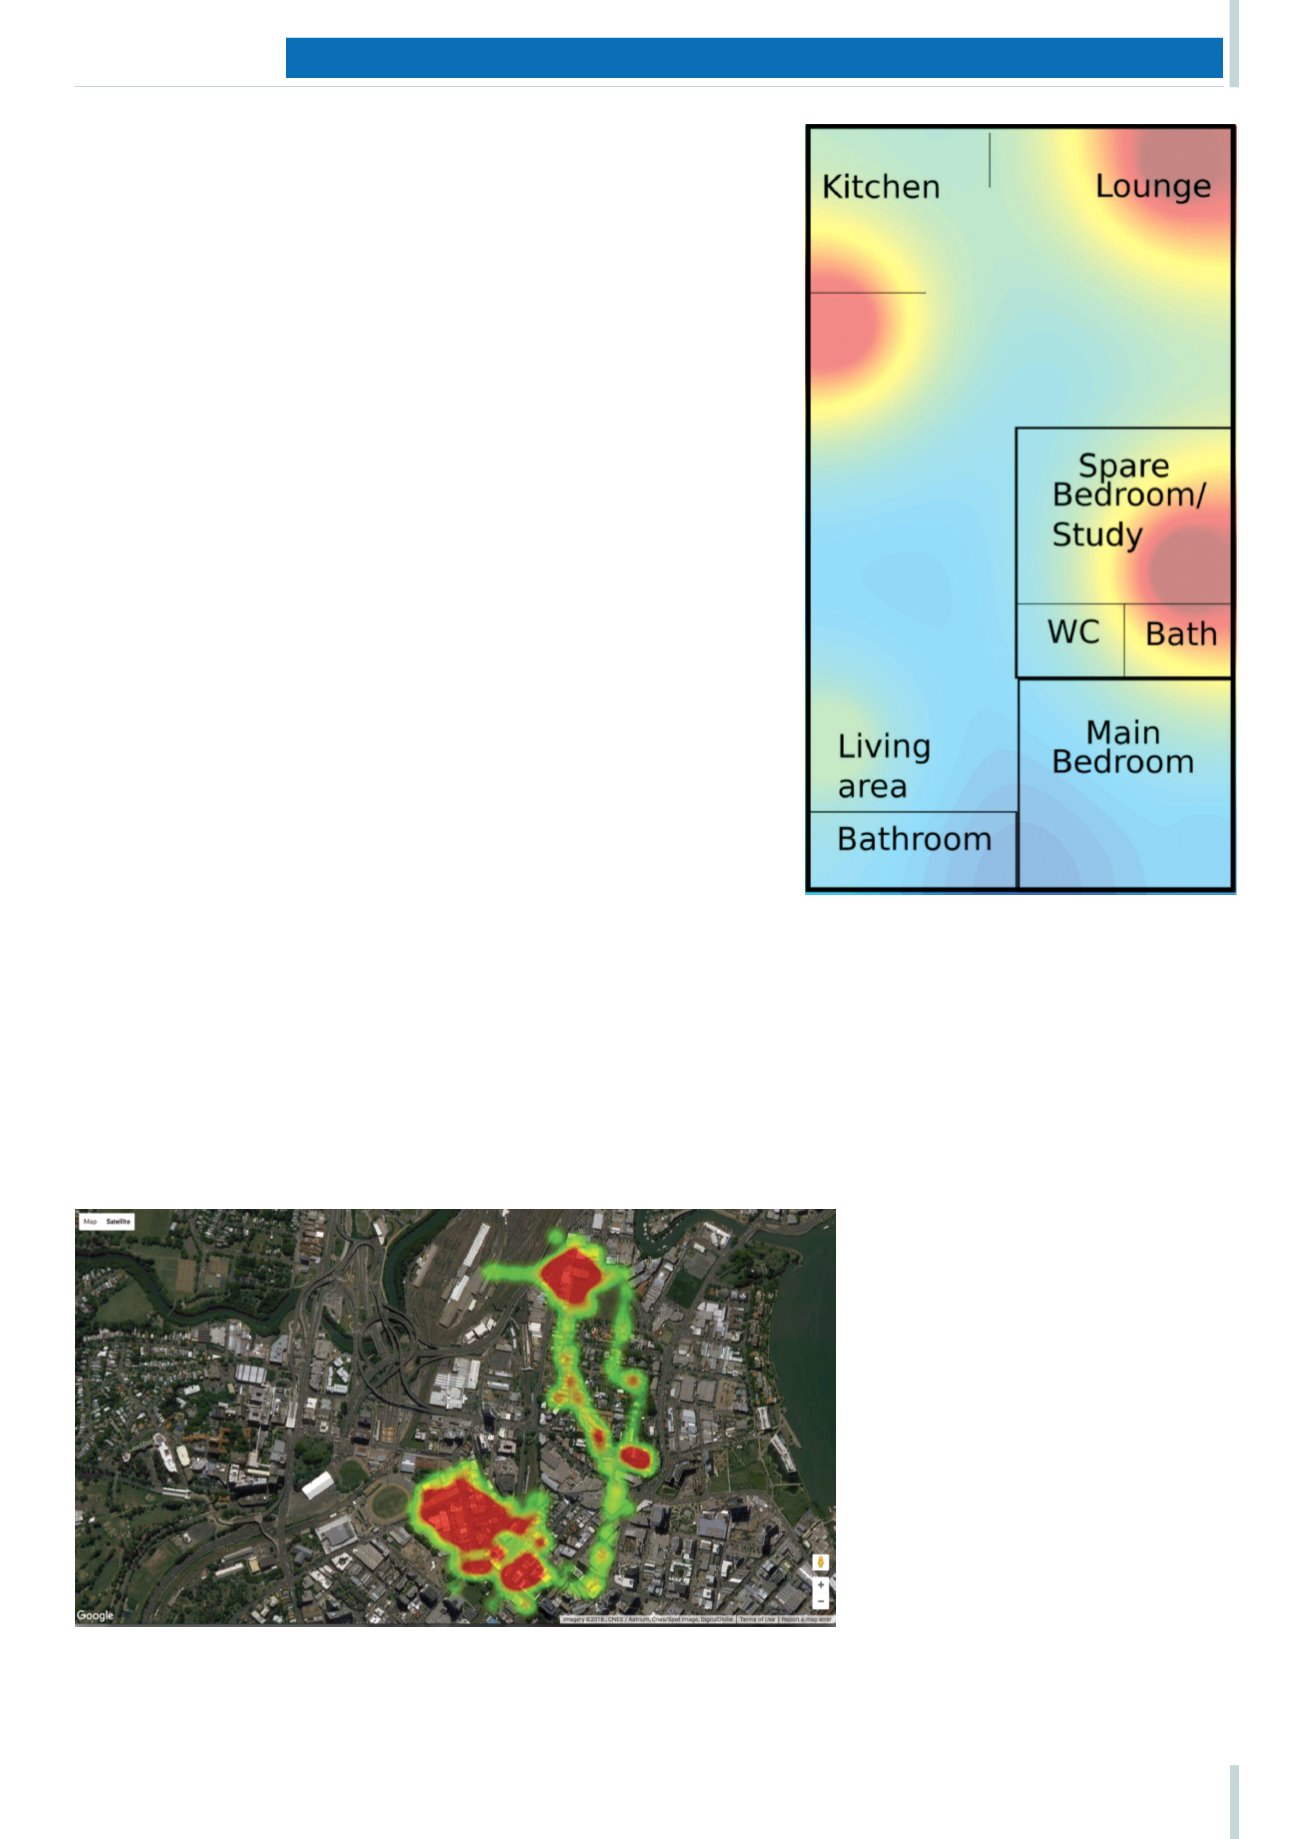
A heatmap, generated with the Lifespace app, showing lifespace for one of the study
participants over one week. Red areas indicate where they spent the most time. (Note:
heatmap transposed from original location)
This image shows the in-home lifespace
for one of the study participants during
waking hours of one week of monitoring
with the app and beacons. Red areas
indicate where most time is spent