



 30 / 66

28
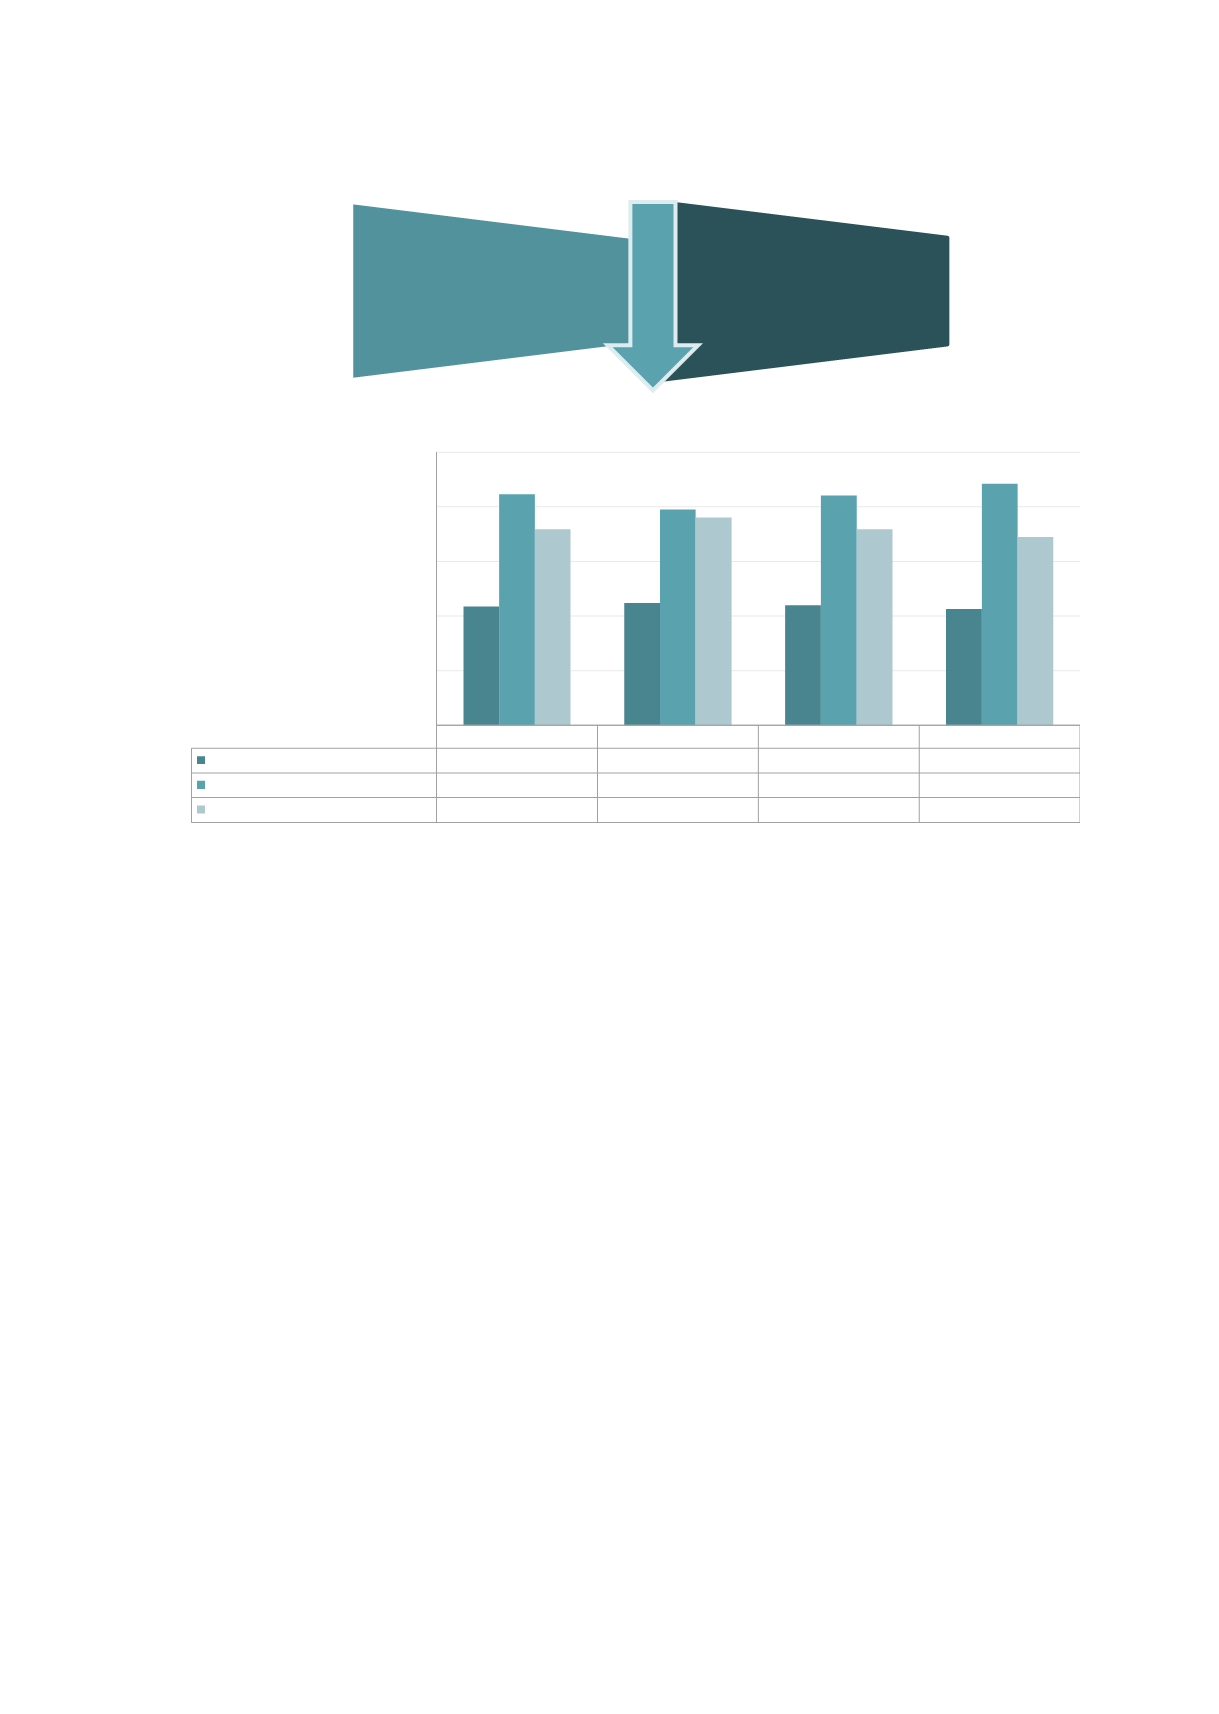
Figure 12: Timing of operative procedures in emergency admissions.
Note: total n=5,359 episodes in 4,238 emergency patients.
Audit period 1 July 2007 to 30 June 2015.
Data not available: n=294 (5.4%).
Hrs: hours.
Comments:
•
The time criticality of a patient’s condition predicts the timing of emergency surgery. Of the emergency admissions
who underwent surgery, 21.8% (1,107/5,065) had surgery within 2 hours of admission, 42.1% (2,131/5,065) had
surgery within 24 hours, and 36.1% (1,827/5,065) had surgery more than 24 hours after admission.
•
During the audit period 63.9% (3,328/5,065) of emergency admissions to a surgical unit required surgery within 24
hours of admission. Strategies to address the associated scheduling problems are being implemented by
government, surgeons and hospitals.
(15-17)
2007-2012
2012-2013
2013-2014
2014-2015
Immediate < 2hrs
21.8%
22.4%
22.0%
21.3%
Emergency < 24 hrs
42.3%
39.5%
42.1%
44.2%
Scheduled emergency > 24 hrs
35.9%
38.1%
35.9%
34.5%
0%
10%
20%
30%
40%
50%
Operative cases (%)
66.6%
Emergency 0-24 hours
2007-2014
65.5%
Emergency 0-24 hours
2014-2015
Audit period