



 32 / 66

30
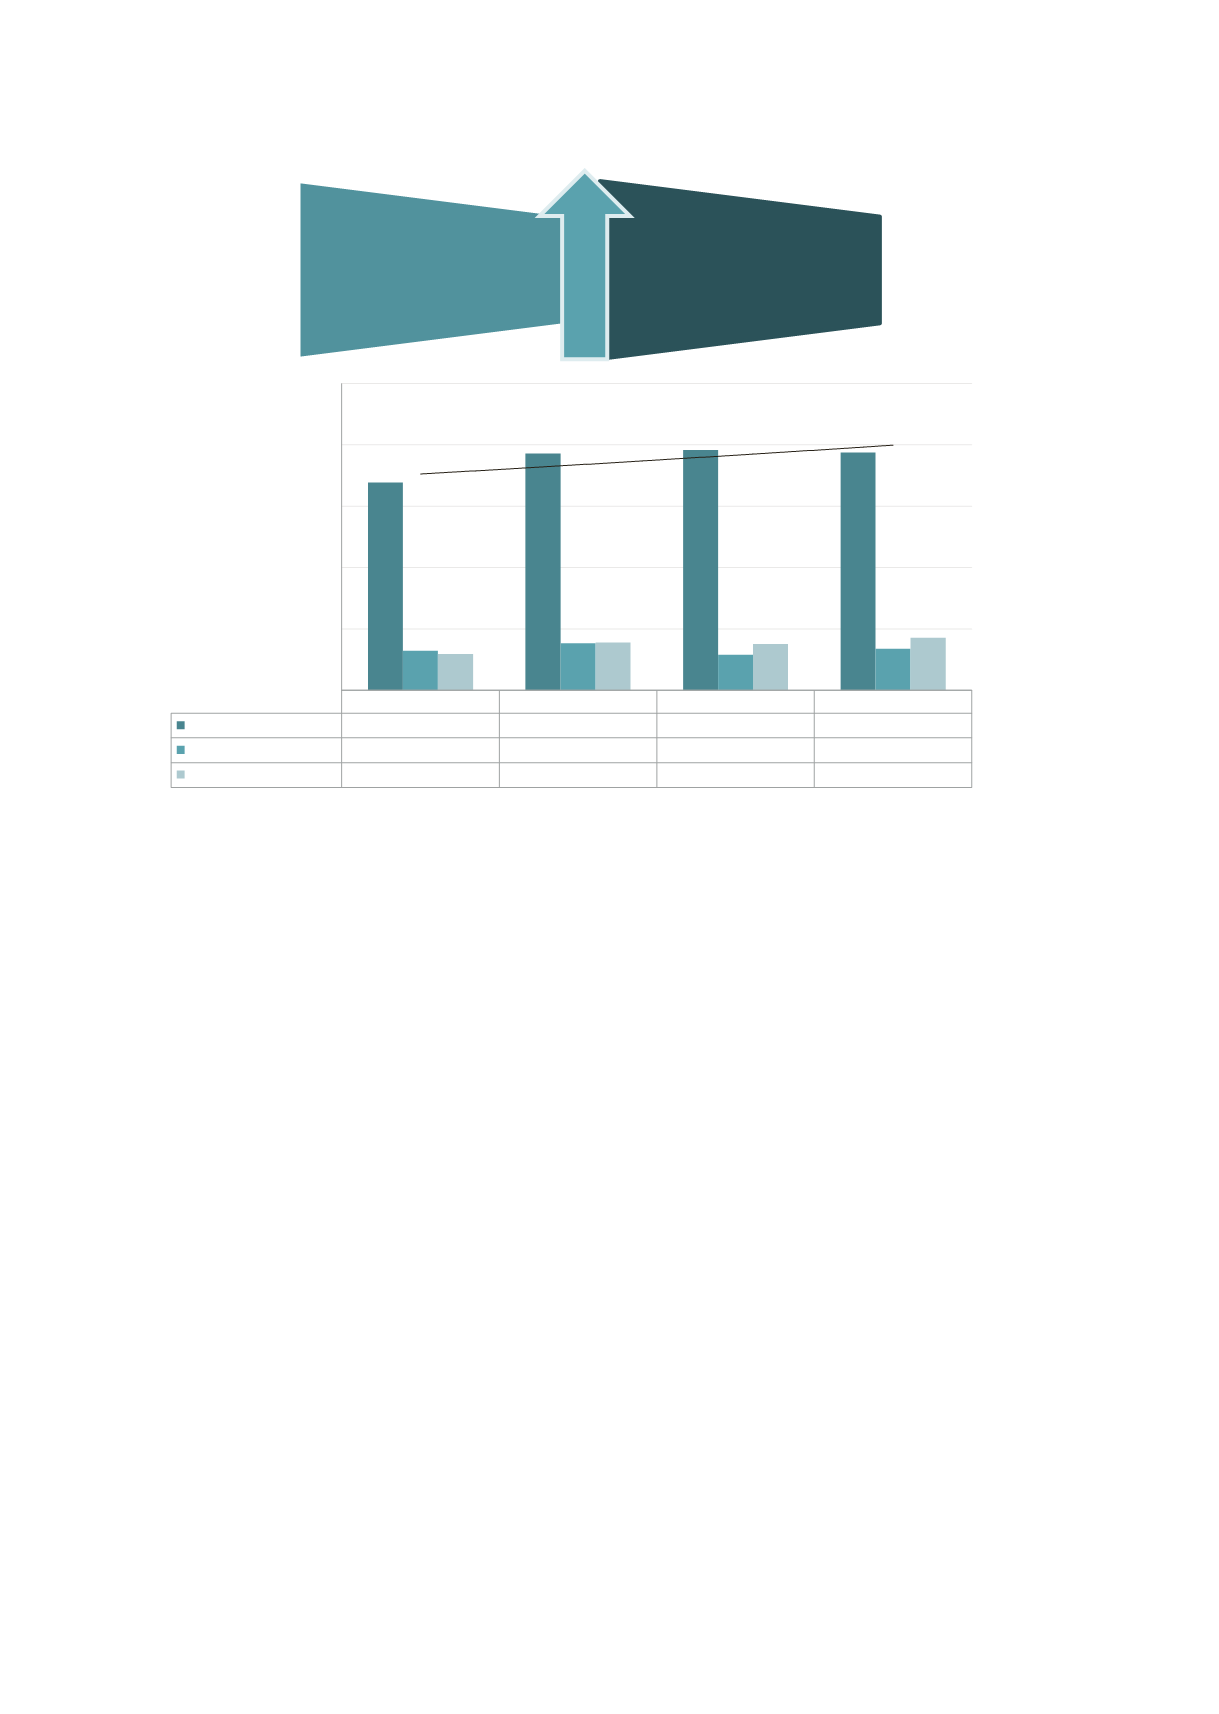
Figure 14: Seniority of consultants performing surgery during unplanned returns to the operating room.
Note: total n=1,991 episodes in 785 unplanned return to theatre patients.
Audit period 1 July 2007 to 30 June 2015.
The consultant operated exponential trend line is curved which highlights considerable rise in consultant involvement.
Comments:
•
Active consultant participation was exponentially higher in cases requiring an unplanned return to the operating
room (
p
<0.001). This result is appropriate as such cases are more challenging and the risks are greater.
•
The frequency of unplanned returns to the operating room by surgical specialty is a reflection of the risk profile
inherent in their casemix or surgical inferences (data not shown). Some surgical specialties are associated with
higher complication risks than others.
•
There were no major differences in unplanned returns to the operating room between metropolitan and rural
regions. The seniority of surgeons operating in rural and metropolitan regions was also similar (data not shown).
2007-2012
2012-2013
2013-2014
2014-2015
Consultant operated
67.8%
77.2%
78.4%
77.5%
Consultant assisted
12.9%
15.3%
11.7%
13.5%
Consultant in theatre
11.9%
15.6%
15.1%
17.1%
0%
20%
40%
60%
80%
100%
Consultant involvement (%)
74.4%
Consultant operated
2007-2014
77.5%
Consultant operated
2014-2015
Audit period