



 33 / 66

31
7.1.2 Postoperative complications
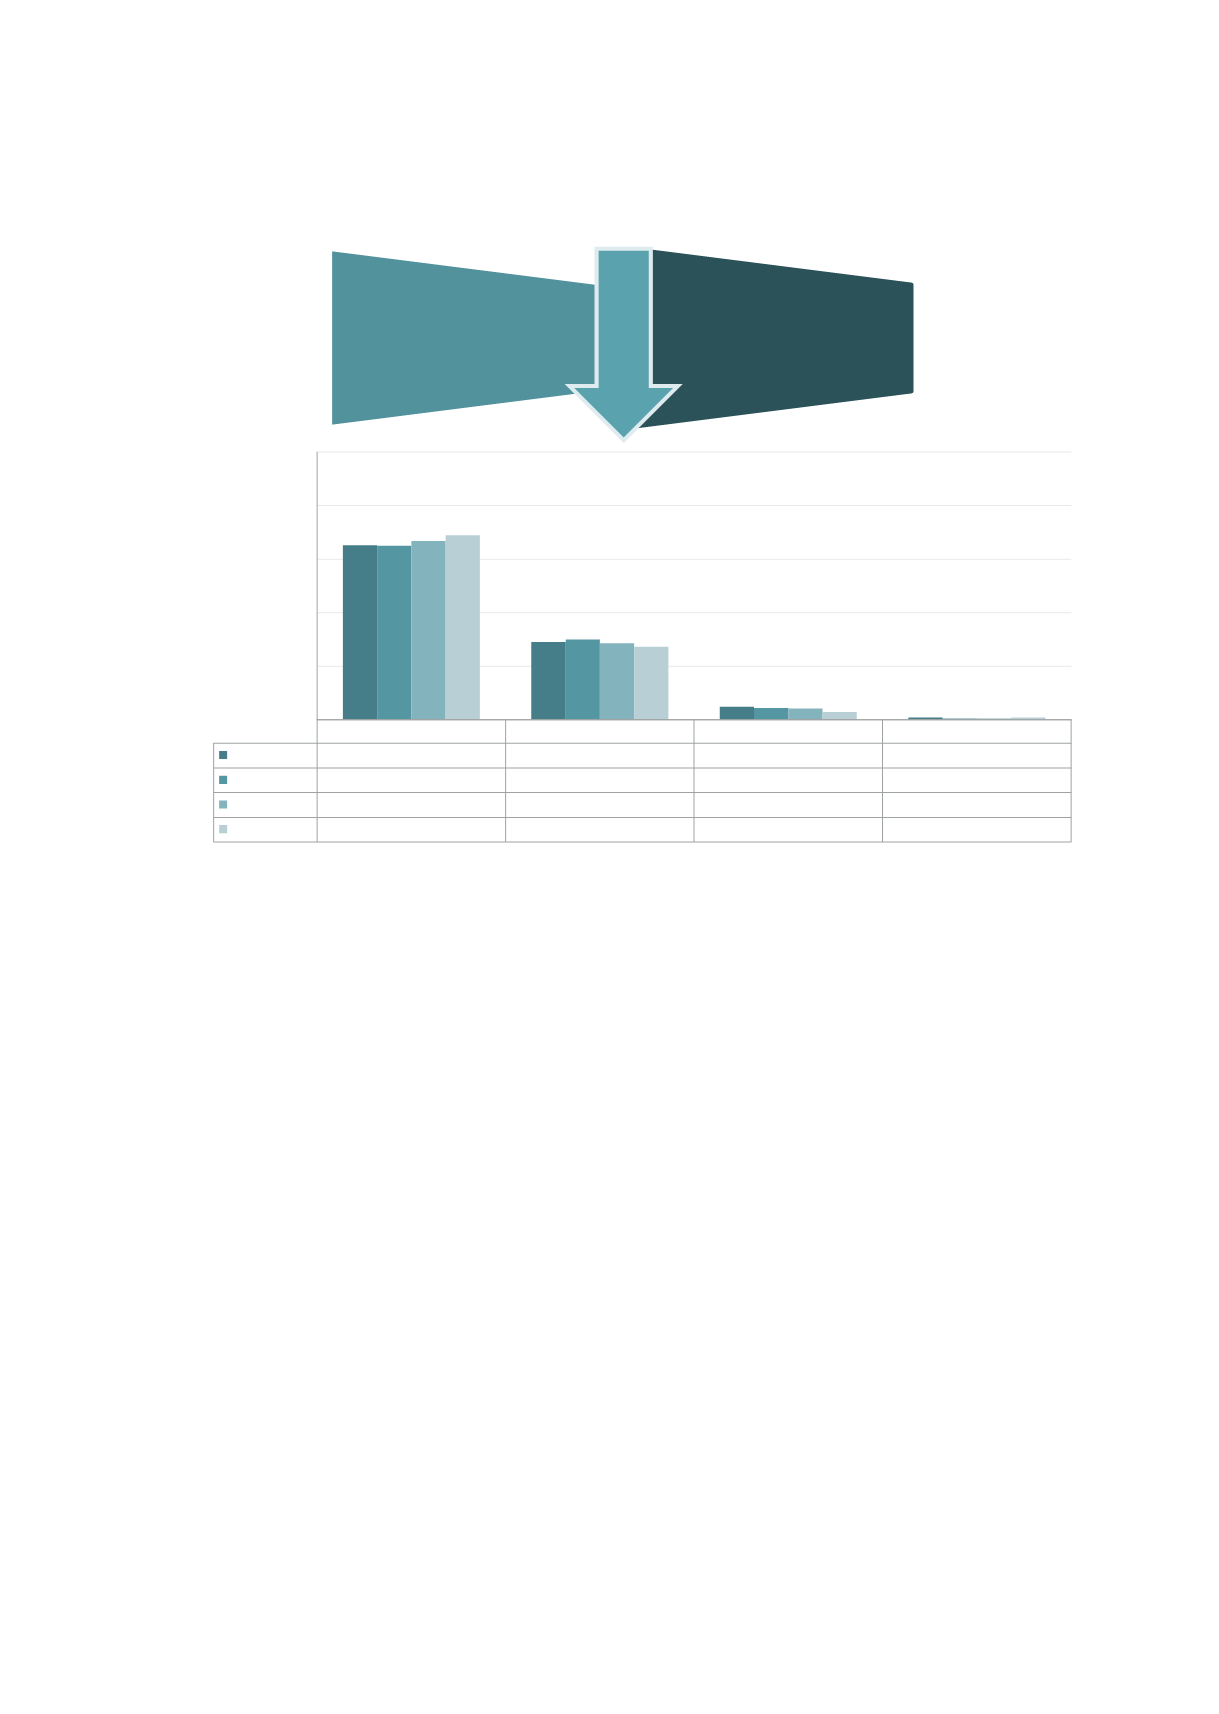
Figure 15: Postoperative complications recorded by treating surgeon.
Note: total n=5,184 patients who underwent operative treatment.
Audit period 1 July 2007 to 30 June 2015.
Comments:
•
The rate of postoperative complications reported by treating surgeons has remained low throughout the audit
period, with a small decrease over time. Of the 65.9% (3,419/5,184) had no complications in the operative cases
audited. A single operative complication was recorded in 27.5% (1,427/5,184) of cases.
0
1
2
≥3
2007-2012
65.2%
29.0%
4.9%
0.9%
2012-2013
65.1%
30.1%
4.4%
0.5%
2013-2014
66.8%
28.5%
4.2%
0.5%
2014-2015
69.0%
27.3%
2.9%
0.8%
0%
20%
40%
60%
80%
100%
Complication distribution (%)
Number of complications
34.3%
Complications
2007-2014
31.0%
Complications
2014-2015