



 38 / 66

36
Delay in diagnosis
7.3.
Treating surgeons were asked to record any perceived delays in establishing a diagnosis and proceeding to definitive
treatment.
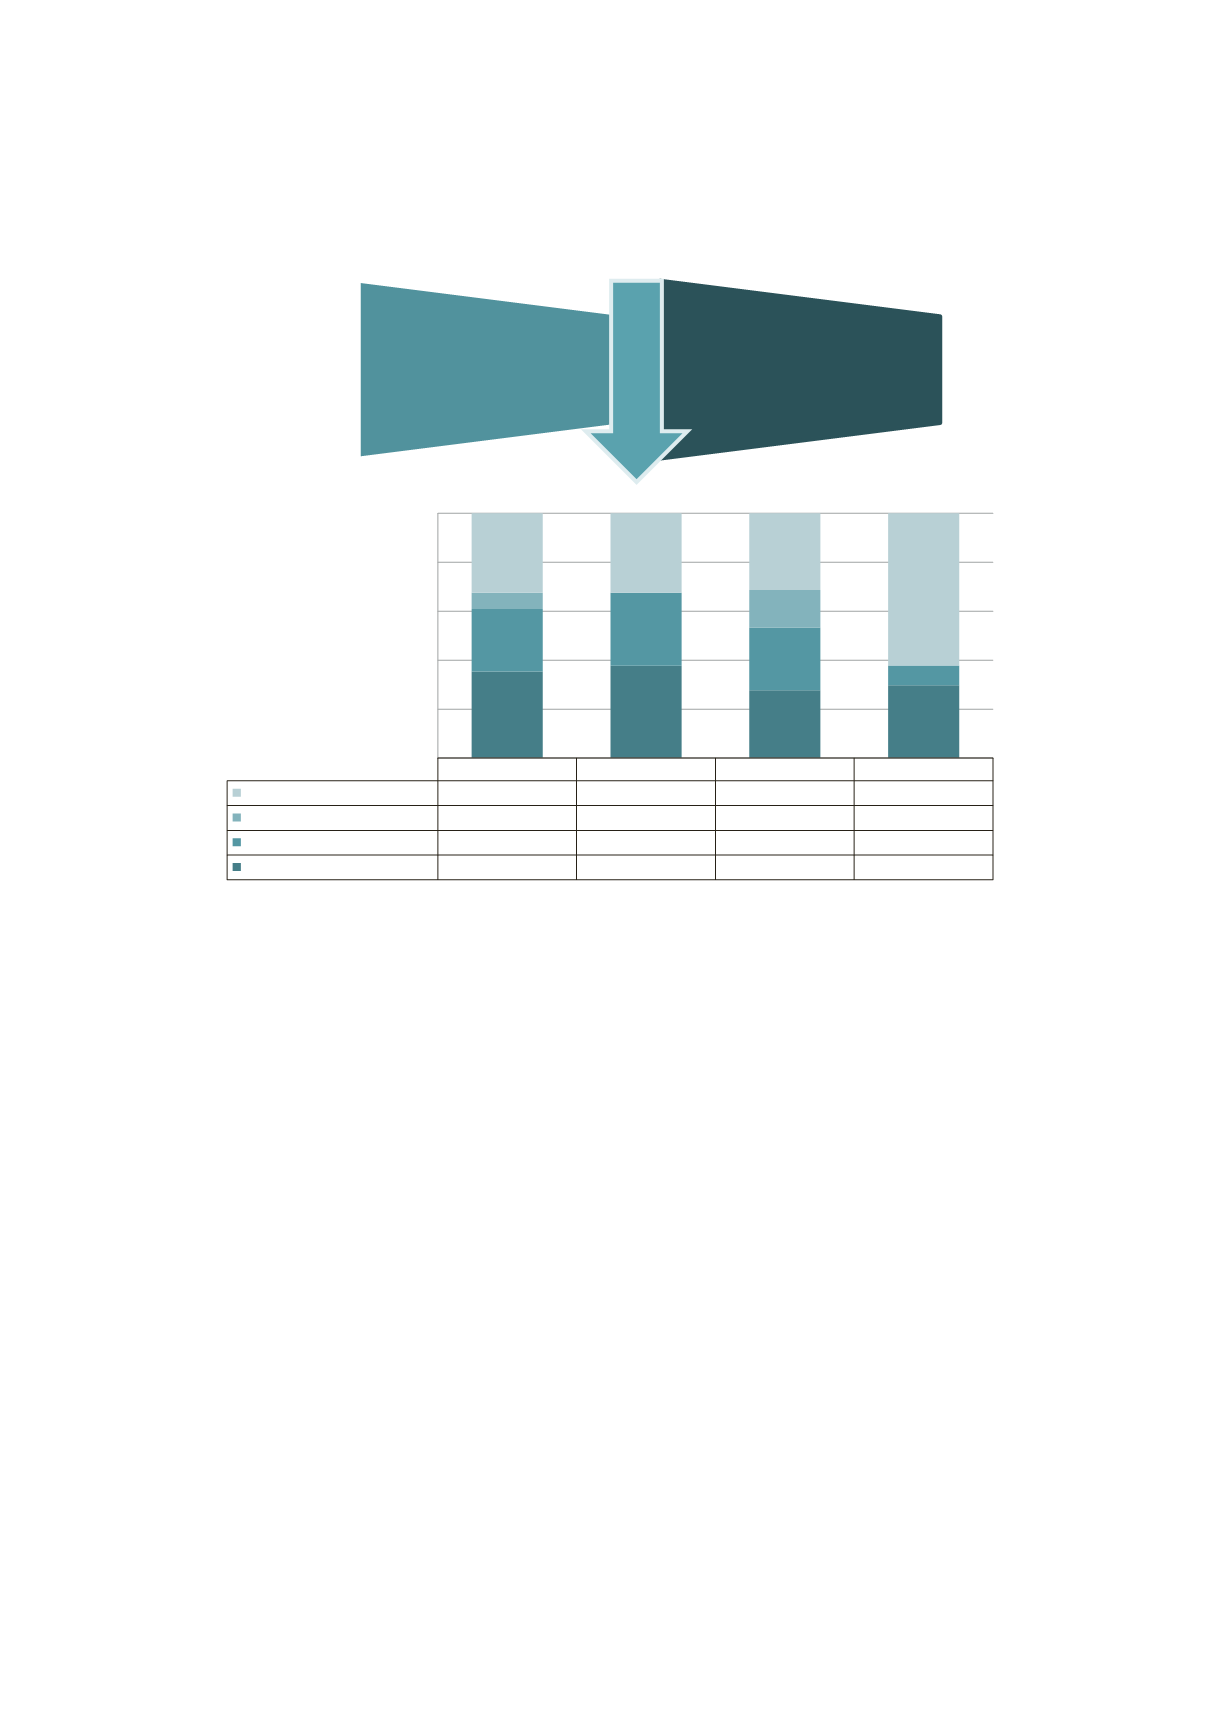
Figure 19: Perceived delays in establishing a diagnosis.
Note: total n=289 issues identified in 266 patients of the 5,184 audited cases.
Audit period 1 July 2007 to 30 June 2015.
Comments:
•
The treating surgeons identified delays in diagnosis in 289 instances of the 266 cases with delays (individual
cases can have multiple delay issues). The diagnostic delays were identified in 5.6% (289/5,184) of the operative
audited cases. When cases were submitted to the first- or second-line assessment process, the incidence of
perceived delay in patient care was 23.5% (1,217/5,184), higher than the incidence identified by treating surgeons.
•
Delay in establishing a diagnosis has dropped from 5.5% in 2007-2012 to 2.9% in 2014-2015; however, this is only
one facet of the concerning rate of delay in implementing definitive treatment shown in the clinical management
issues section 7.9(data not shown).
•
It is important to note that such delays are not always attributable to the surgical team. As published in a recent
review in the United Kingdom on care received by elderly patients undergoing surgery, delay between admission
and operation was related to risk assessment which “should include input from senior surgeons [or] anaesthetists”.
(21)
2007-2012
2012-2013
2013-2014
2014-2015
Unavoidable factors
33.9%
70.0%
81.8%
76.2%
Results not seen
7.0%
0.0%
40.0%
0.0%
Misinterpretation of results
26.6%
64.3%
66.7%
10.0%
Inexperienced staff
36.9%
81.3%
72.2%
36.4%
0%
20%
40%
60%
80%
100%
Delays in diagnosis (%)
5.5%
Delays in diagnosis
2007-2014
2.9%
Delays in diagnosis
2014-2015
Audit period