



 41 / 66

39
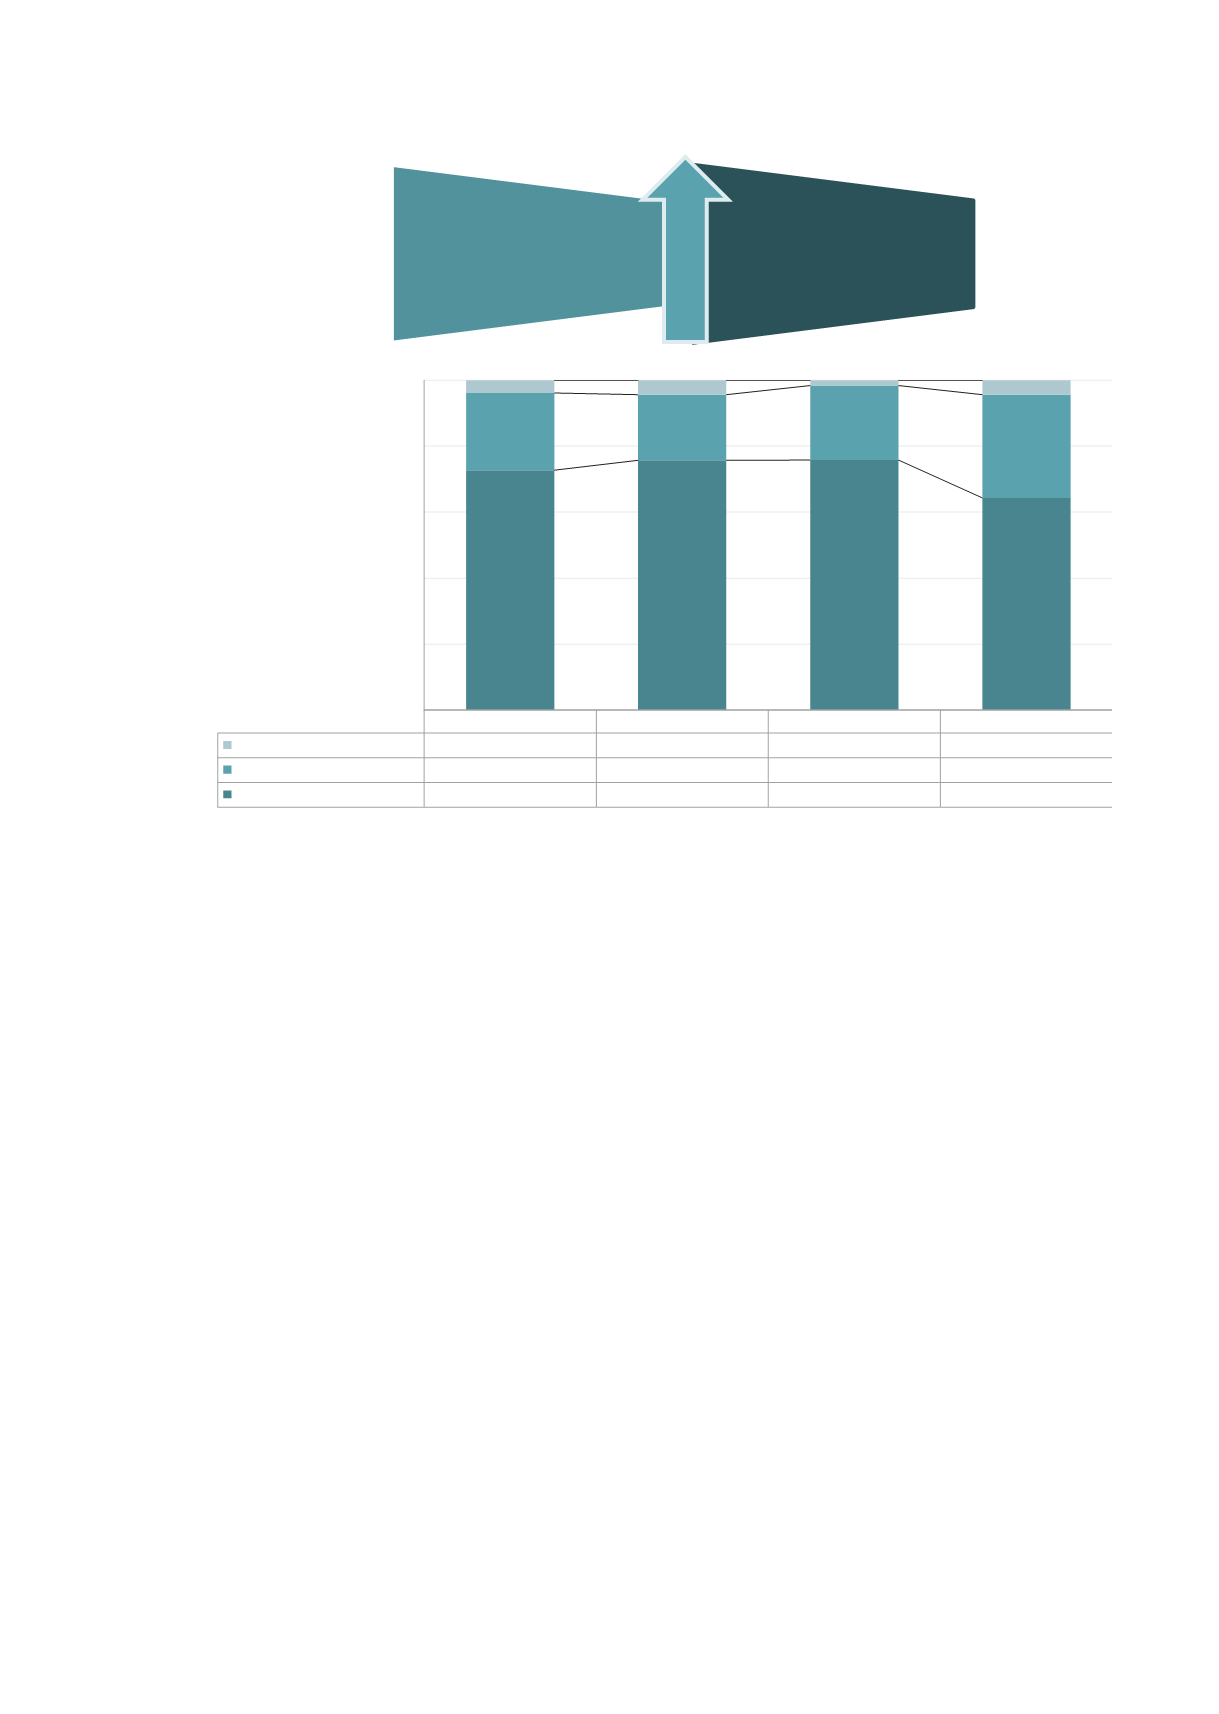
Figure 22: Reasons given by treating surgeon for not providing DVT prophylaxis.
Note: total n=1,042 patients not receiving prophylaxis in 5,184 operative cases.
Audit period 1 July 2007 to 30 June 2015.
Data not available: n=86 (2%)
DVT: deep vein thrombosis.
Comments:
•
Overall, 20.1% of patients received no prophylaxis (1,042/5,184). In the majority of these cases in 95.7%
(871/1,042) this was a conscious decision by the treating team.
•
The omission rate has increased from 3.9% (20/591) in 2007-2012 to 4.4% in 2014-2015 (5/115) although this was
not statistically significant (
p
=0.07).
2007-2012
2012-2013
2013-2014
2014-2015
Omission/error
3.9%
4.4%
1.6%
4.4%
Active decision to withold
23.4%
19.9%
22.6%
31.3%
Not appropriate
72.7%
75.8%
75.8%
64.4%
0%
20%
40%
60%
80%
100%
Reason DVT prophylaxis not used
3.3%
Omission error
2007-2014
4.4%
Omission error
2014-2015
Audit period