


 44 / 60

44
|
CENTRAL COAST
REGIONAL SNAPSHOT
2016
Cultural Diversity and
Indigenous Population
Analysis of the country of birth of the population in Central Coast
NSW in 2011 compared to New South Wales shows that there was
a smaller proportion of people born overseas, as well as a smaller
proportion of people from a non-English speaking background.
Overall, 14.0% of the population was born overseas, and 5.2%
were from a non-English speaking background, compared with
25.7% and 18.6% respectively for New South Wales.
The largest non-English speaking country of birth in Central Coast
NSW was Philippines, where 0.4% of the population, or 1,280
people, were born.
The major differences between the countries of birth of the
population in Central Coast NSW and New South Wales were:
• A larger percentage of people born in United Kingdom
(5.8% compared to 4.0%)
• A smaller percentage of people born in China
(0.3% compared to 2.3%)
• A smaller percentage of people born in India
(0.2% compared to 1.4%)
Between 2006 and 2011, the number of people born overseas
increased by 4,049 or 10.2%, and the number of people from a
non-English speaking background increased by 2,378 or 17.0%.
The largest changes in birthplace countries of the population
in this area between 2006 and 2011 were for those born in:
• United Kingdom (+603 persons)
• New Zealand (+446 persons)
• China (+309 persons)
• South Africa (+292 persons)
Indigenous Population
In the 2011 Census 2.9% of the Central Coast Population identified
as Aboriginal or Torres Strait Islander which is only slightly higher
than the NSW rate of 2.5%. (Australian Bureau of Statistics, 2016)
The Central Coast is the traditional lands of the Darkinjung
people. In 2006 the region reported an Aboriginal population of
7130, which by 2011 had risen to 9063 people identifying as
Indigenous. In 2009 the Aboriginal population was projected to
have an annual average growth rate of 3 per cent, which would
result in an Aboriginal population of 11,161 by 2021. This forecast
growth rate makes the Aboriginal population in the region the
second fastest growing Aboriginal population in New South Wales
(NSW Department of Aboriginal Affairs, 2009).
The aboriginal community is represented on the Central Coast
by the Darkinjung Local Aboriginal Land Council, which has
emerged as one of the largest private land-owners in the
region and has been successful in partnering with a range of
organisations to deliver much needed services and assistance to
the indigenous population.
Sustainable Communities and Population Growth
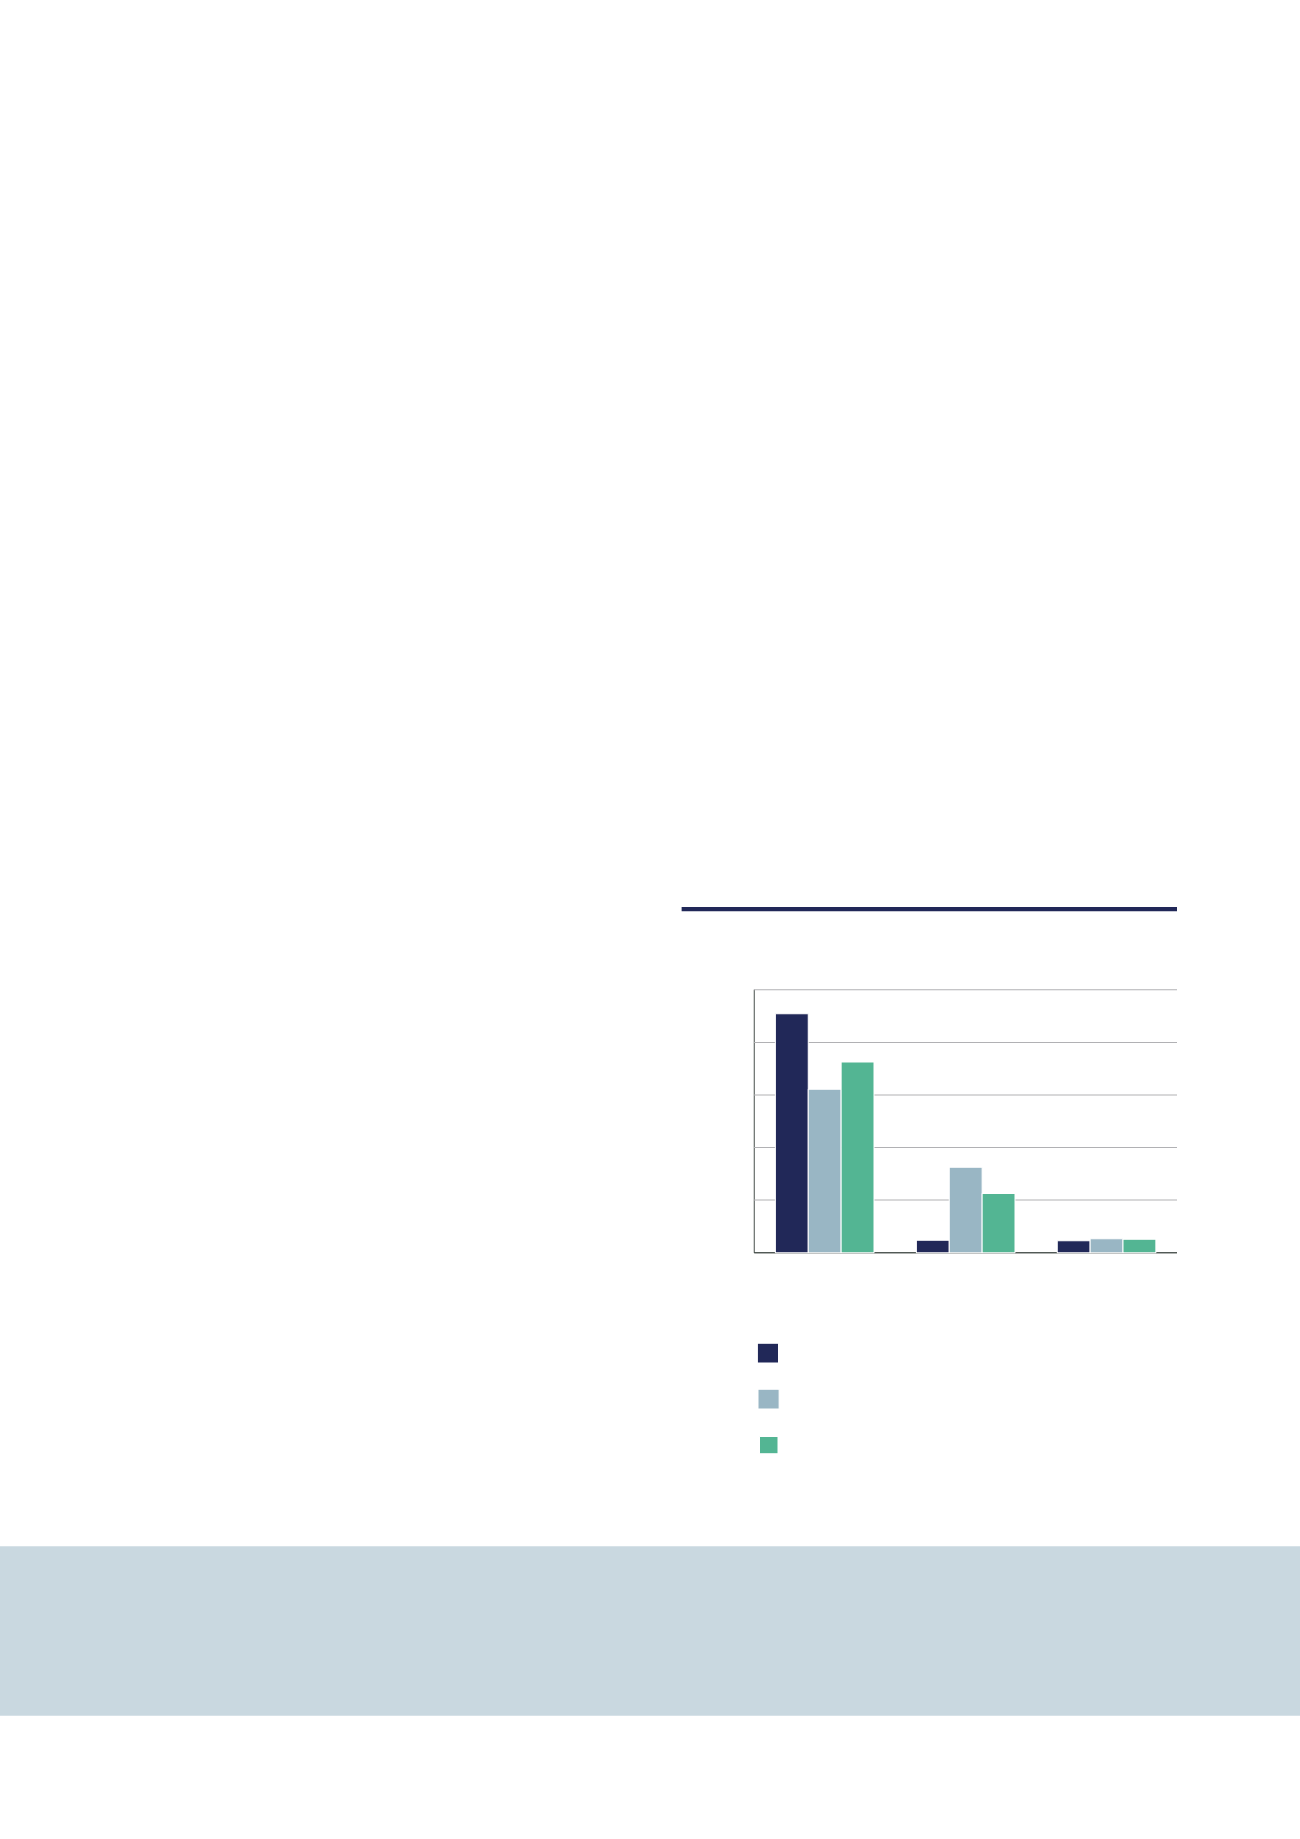
LANGUAGE SPOKEN AT HOME
0
20
40
60
80
100
New South Wales
Greater Sydney
Central Coast
Not stated
Non-English
total
Speaks
English only
Percentage
5.2%
of the Central Coast population
is from a non-English speaking
background
SOURCE:
NIEIR (ABS 2011)