


 46 / 60

46
|
CENTRAL COAST
REGIONAL SNAPSHOT
2016
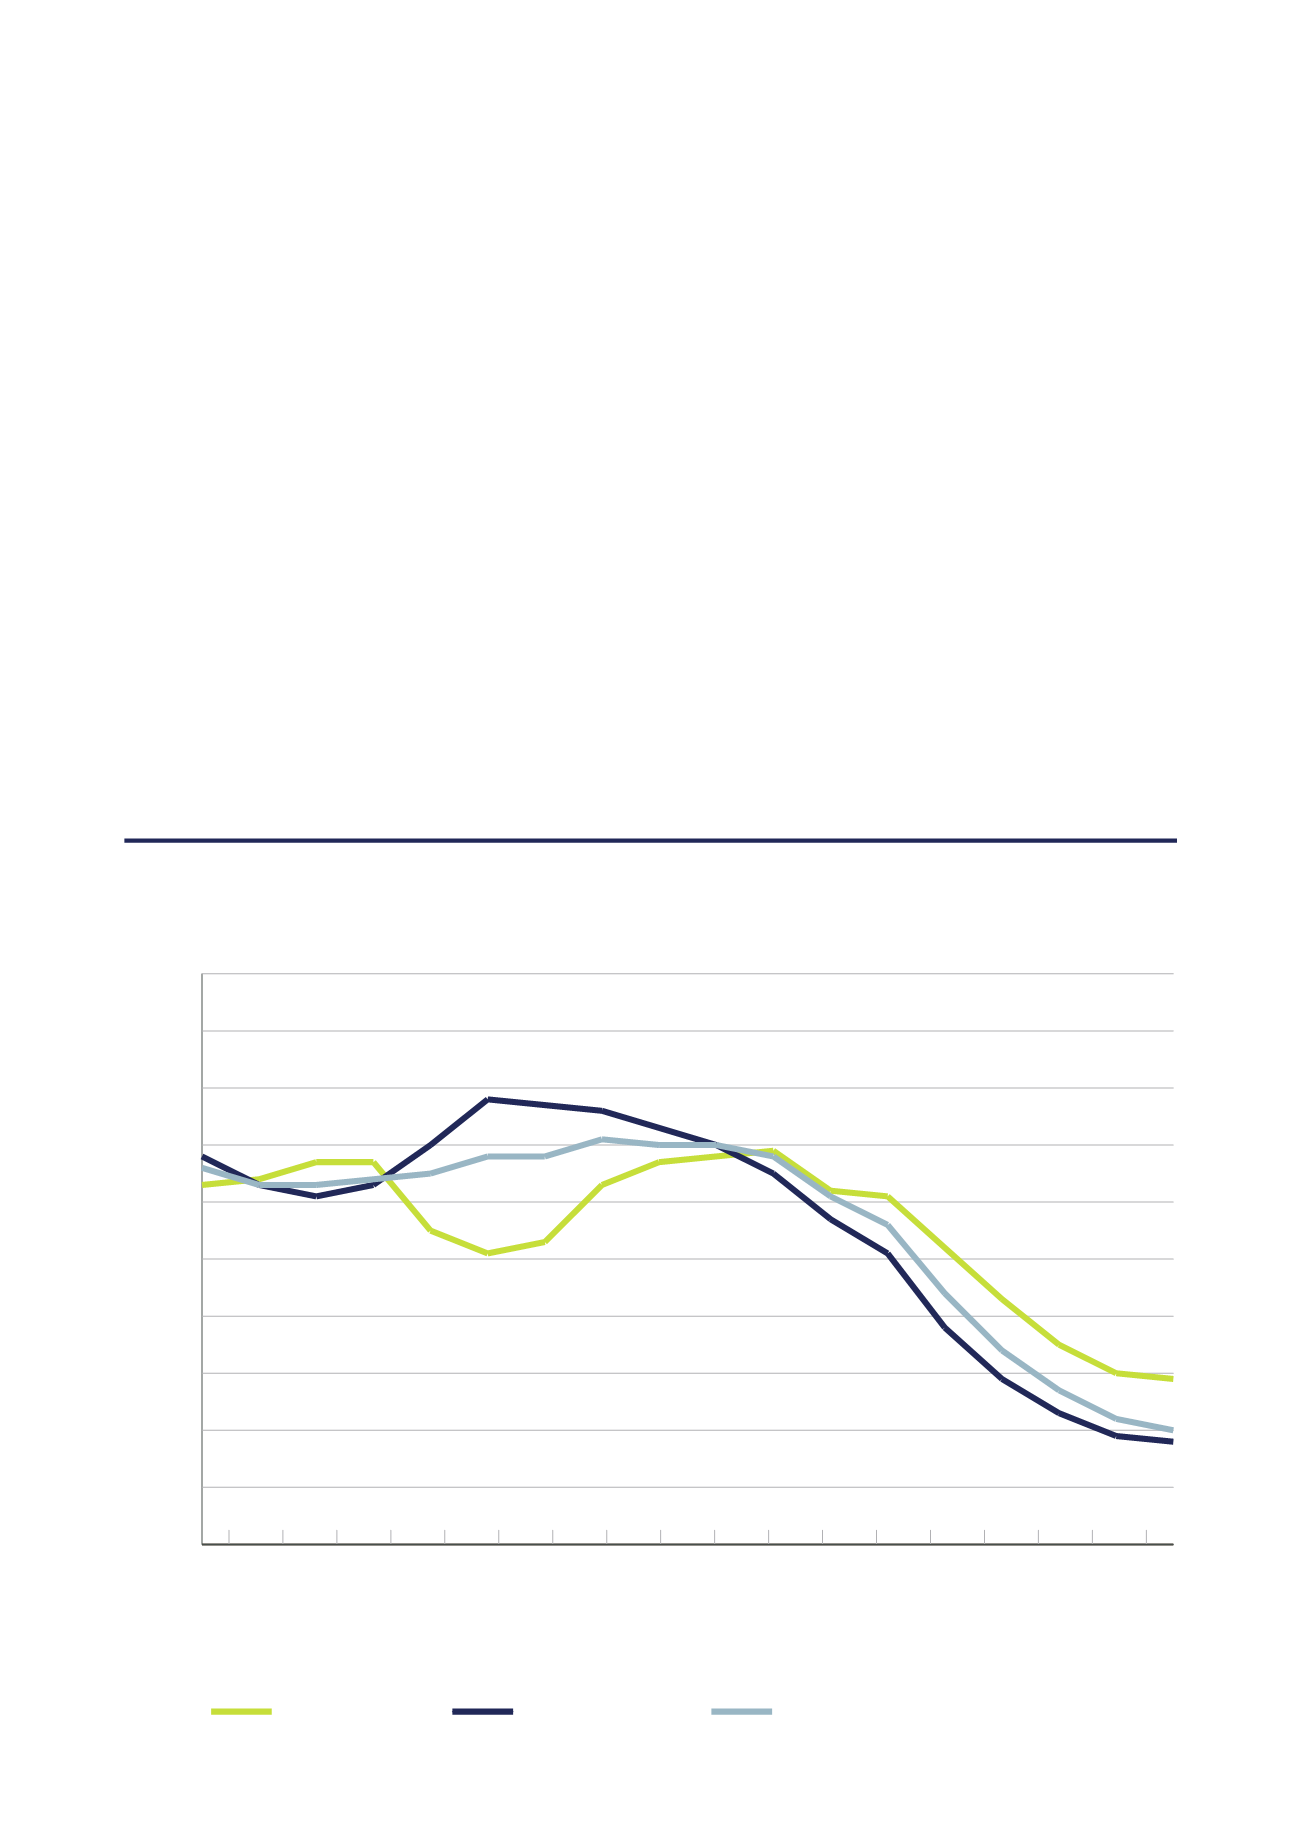
Age structure - Five year age groups
Analysis of the five year age groups of Central Coast NSW in
2011 compared to New South Wales shows that there was a
similar proportion of people in the younger age groups (under 15)
and a higher proportion of people in the older age groups (65+).
Overall, 19.4% of the population was aged between 0 and 15,
and 19.0% were aged 65 years and over, compared with 19.3%
and 14.7% respectively for New South Wales.
The major differences between the age structure of Central
Coast NSW and New South Wales were:
• A larger percentage of persons aged 70 to 74 (4.3%
compared to 3.4%)
• A smaller percentage of persons aged 25 to 29 (5.1%
compared to 6.8%)
• A smaller percentage of persons aged 30 to 34 (5.3%
compared to 6.8%)
• A smaller percentage of persons aged 20 to 24 (5.5%
compared to 6.5%)
From 2006 to 2011, Central Coast NSW’s population increased
by 14,225 people (4.8%). This represents an average annual
population change of 0.94% per year over the period.
The largest changes in age structure in the Region between 2006
and 2011 were in the age group 50 – 75 with an increase of
10,793 people.
AGE STRUCTURE - FIVE YEAR AGE GROUPS 2011
Sustainable Communities and Population Growth
0
1
2
3
4
5
6
7
8
9
10
New South Wales
Greater Sydney
Central Coast
85 +
80 - 84
75 - 79
70 - 74
65 - 69
60 - 64
55 - 59
50 - 54
45 - 49
40 - 44
35 - 39
30 - 34
25 - 29
20 - 24
15 - 19
9 - 14
5 - 9
0 - 4
Age
Percentage of Population
SOURCE:
NIEIR (ABS 2011)