


 47 / 60

CENTRAL COAST
REGIONAL SNAPSHOT
2016
|
47
Sustainable Communities and Population Growth
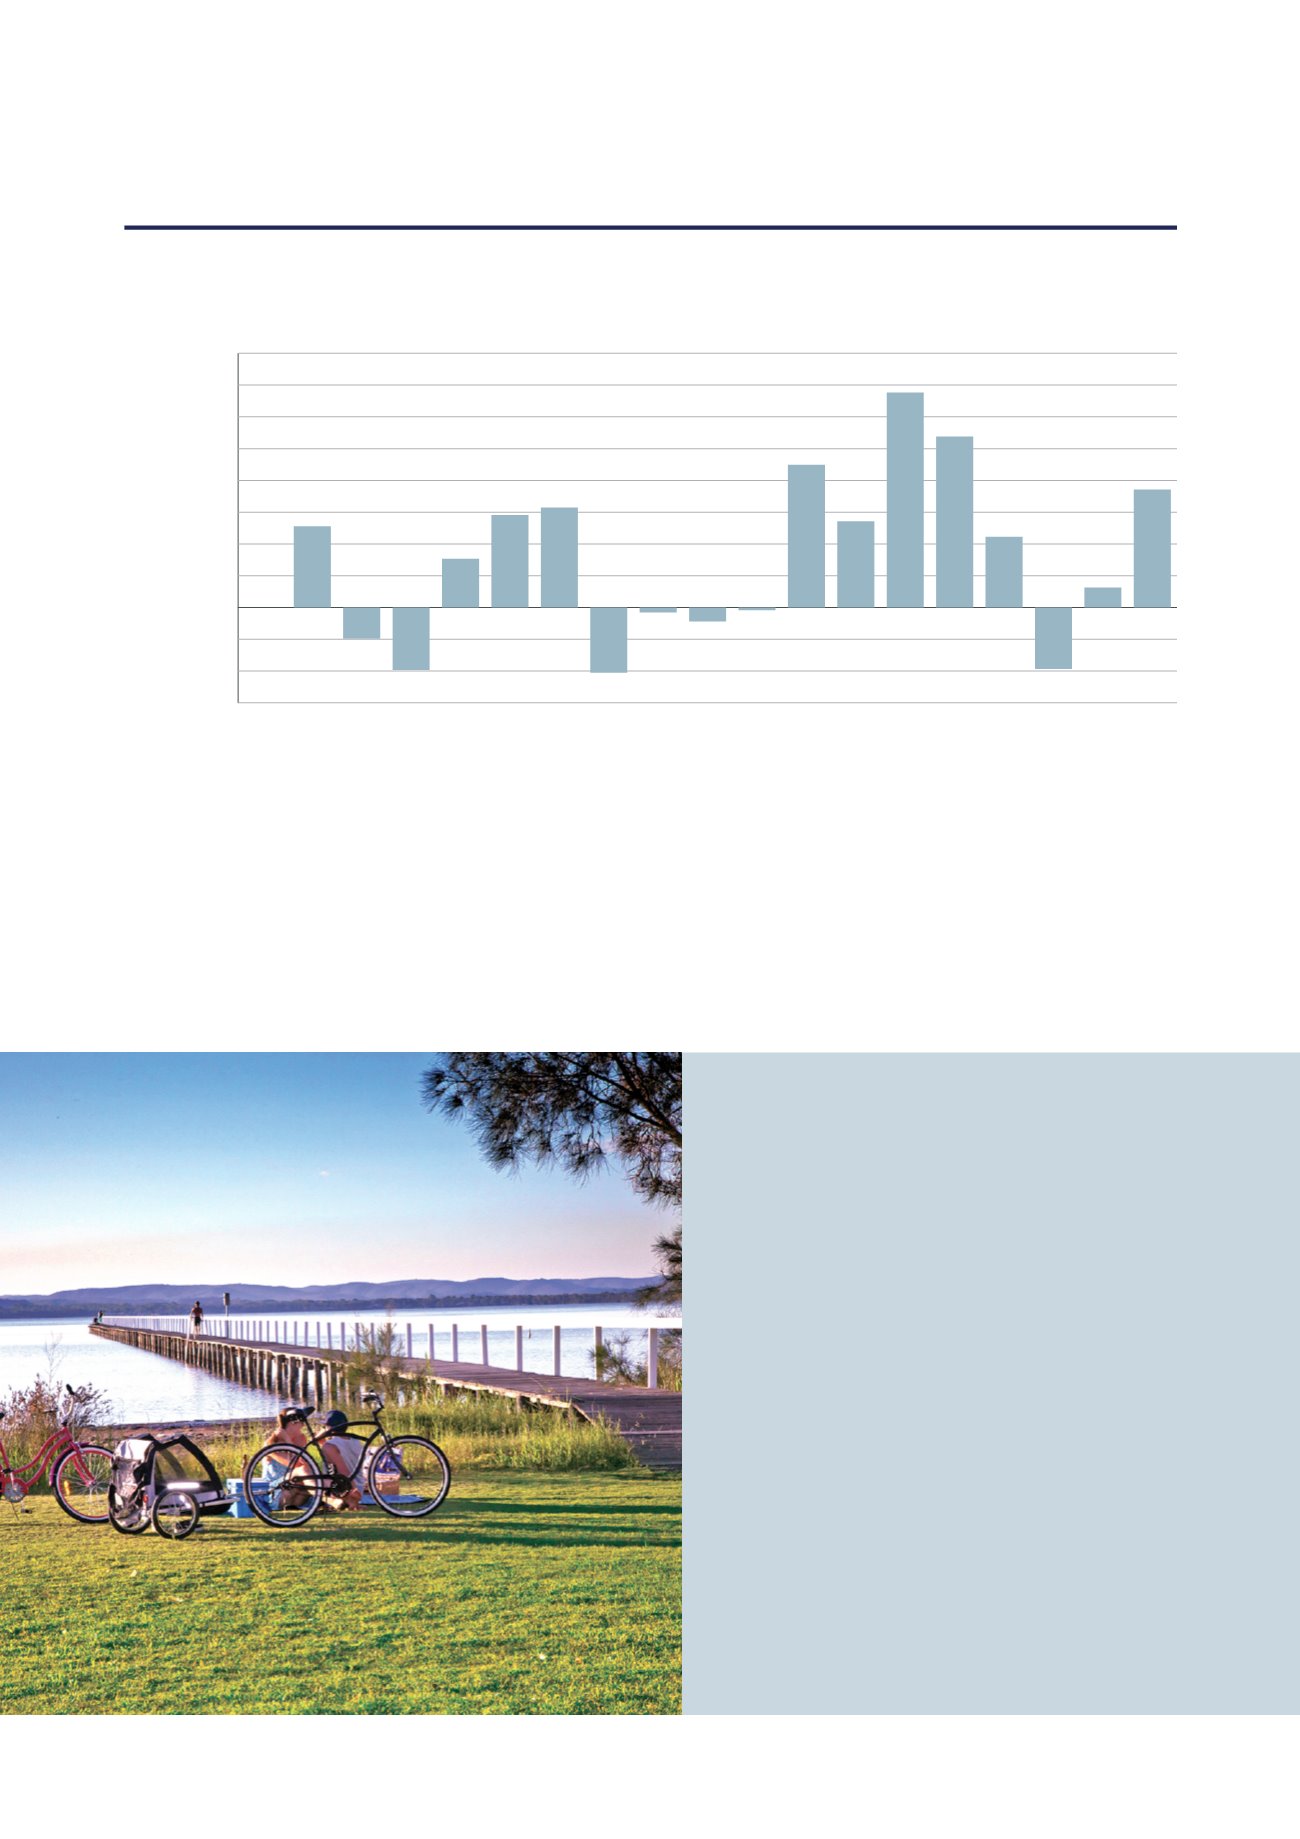
CHANGE IN AGE STRUCTURE
-1500
-1000
-500
0
500
1000
1500
2000
2500
3000
3500
4000
85 +
80 - 84
75 - 79
70 - 74
65 - 69
60 - 64
55 - 59
50 - 54
45 - 49
40 - 44
35 - 39
30 - 34
25 - 29
20 - 24
15 - 19
10 - 14
5 - 9
0 - 4
Change in number of people
The largest changes in age
structure in the Region
between 2006 and 2011
were in the age group
50 – 75 with an increase
of 10,793 people.
SOURCE:
NIEIR (ABS 2011)