


 45 / 60

CENTRAL COAST
REGIONAL SNAPSHOT
2016
|
45
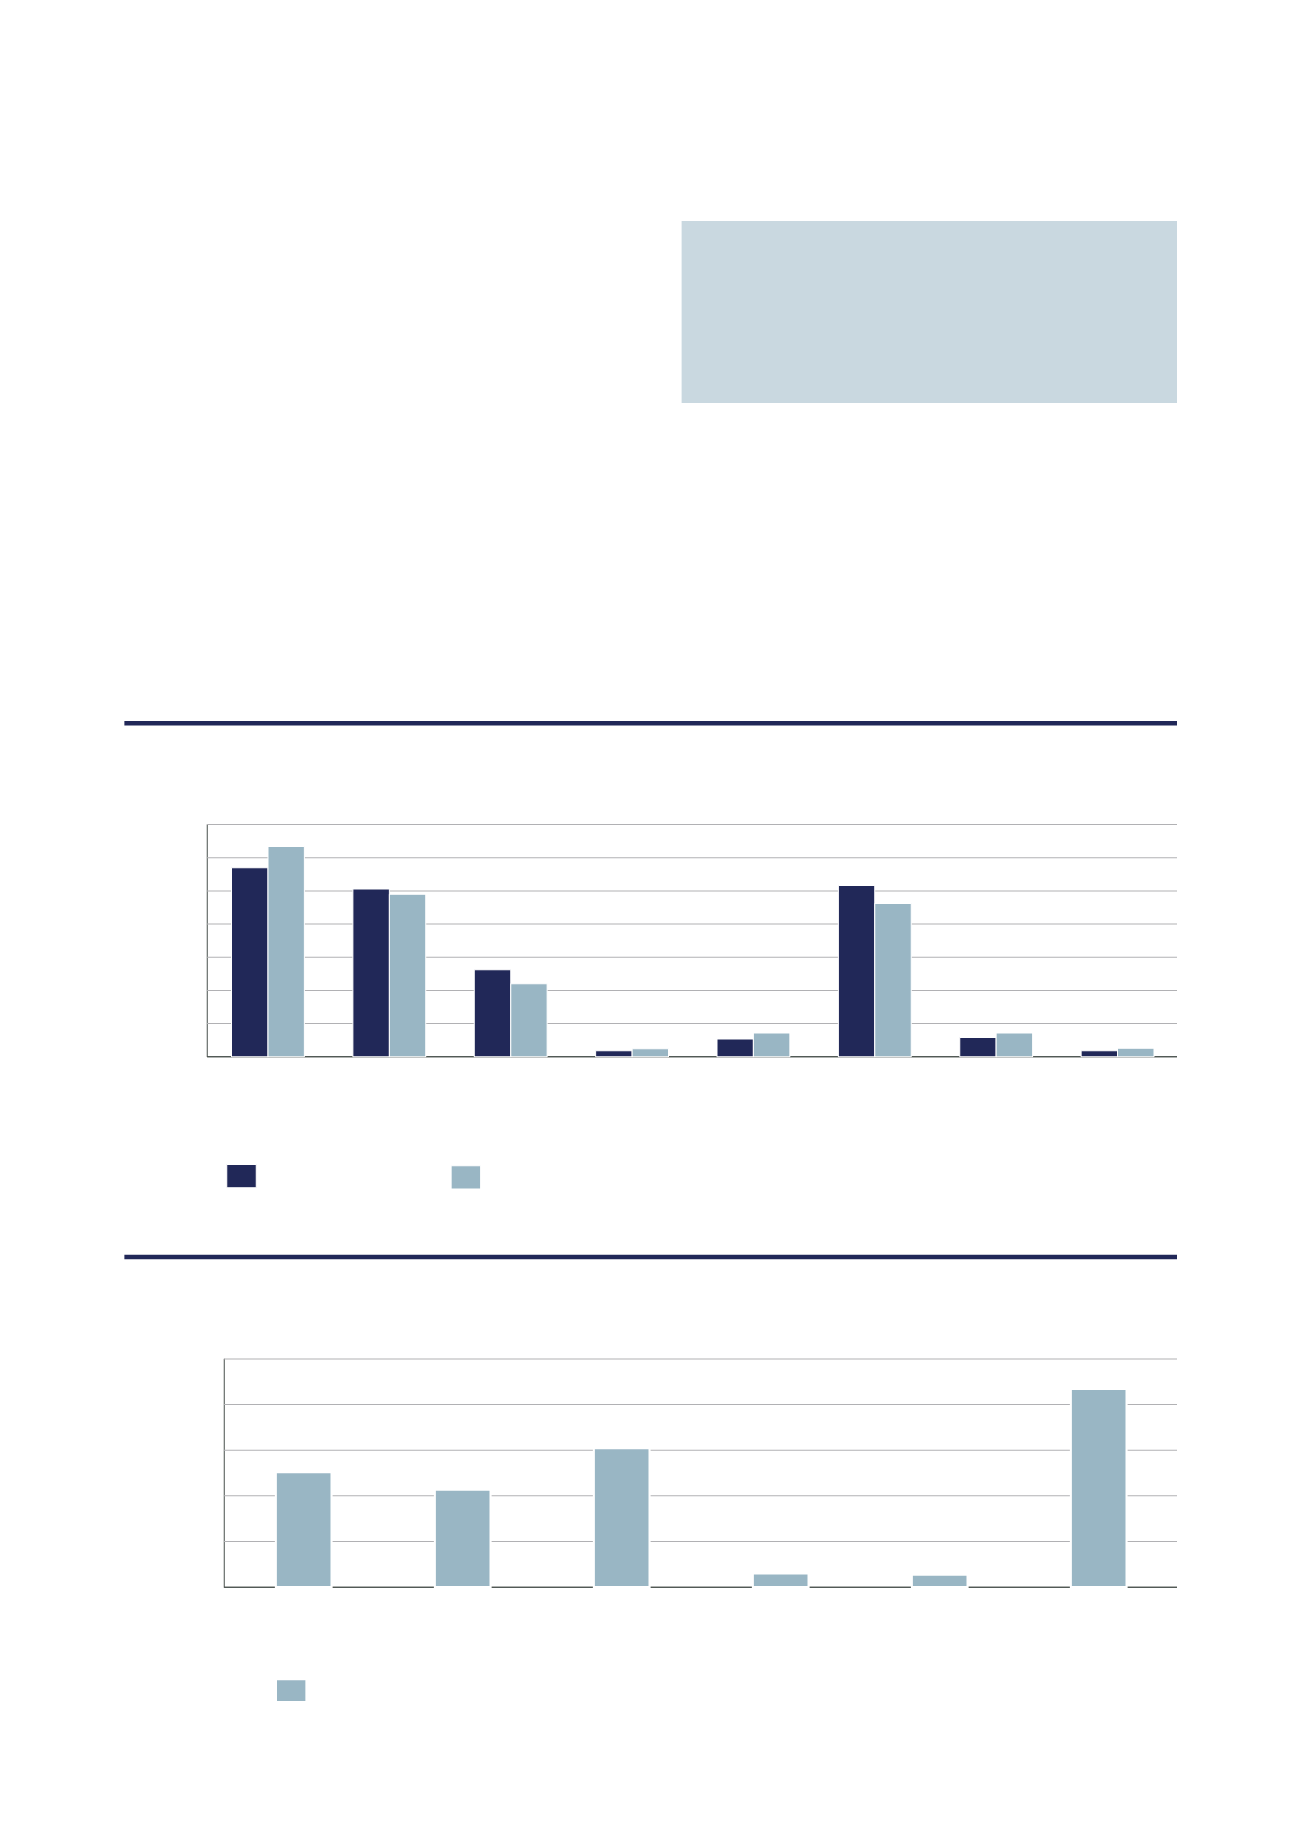
Household and Family Types
Analysis of the household/family types in Central Coast NSW
in 2011 compared to New South Wales shows that there was
a lower proportion of couple families with child(ren) as well as a
higher proportion of one-parent families. Overall, 28.5% of total
families were couple families with child(ren), and 13.1% were one-
parent families, compared with 31.7% and 11.0% respectively for
New South Wales.
There were a higher proportion of lone person households and
a higher proportion of couples without children. Overall, the
proportion of lone person households was 25.8% compared to
23.1% in New South Wales while the proportion of couples without
children was 25.3% compared to 24.5% in New South Wales.
Between 2006 and 2011 the number
of households in the Central Coast
increased by 5,728.
The largest changes in family household types in Central
Coast NSW between 2006 and 2011 were:
• Lone person (+2,171 households)
• One parent families (+1,521 households)
• Couples with children (+1,260 households)
• Couples without children (+1,068 households)
HOUSEHOLD TYPE 2011
CHANGE IN HOUSEHOLD TYPE 2006-2011
Sustainable Communities and Population Growth
0
5
10
15
20
25
30
35
New South Wales
Central Coast
Visitor only
households
Other not
classifiable
household
Lone
person
Group
household
Other
families
One parent
families
Couples
without
children
Couples with
children
$ Thousand
0
500
1000
1500
2000
2500
Change in household type 2006 - 2011
Lone person
Group household
Other families
One parent
families
Couples
without children
Couples with
children
No. of households
SOURCE:
NIEIR (ABS 2011)
SOURCE:
NIEIR (ABS 2011)